ATR과 트레일링 스톱을 기반으로 한 슈퍼트렌드 전략

개요
이 전략은 평균 실제 변동량 (ATR) 지표에 기초하여 이동 스톱 라인과 반전 라인을 설계한다. 그것은 가격 변화에 따라 trailing stop loss, 즉 스톱 라인을 조정하는 추적한다. 구체적으로, 가격 변화가 1% 이상이면 스톱 라인은 이익 방향으로 고정 비율로 이동한다. 가격이 스톱 라인을 돌파 할 때, 지위는 자동으로 평소된다. 이것은 이익을 잠금 할 수 있으며 손실을 줄일 수도 있습니다.
전략 원칙
이 전략은 ATR 지표를 사용하여 스톱 라인을 계산한다. 구체적인 공식은 다음과 같다:
pine
atr = multplierFactor * atr(barsBack)
longStop = hl2 - atr
shortStop = hl2 + atr
이 중 multiplierFactor는 ATR 확대 계수이고, barsBack은 ATR 주기 수이다. ATR 값이 클수록, 시장의 변동성이 클 것이다.
ATR 값에 따라 장점 상쇄선 (longStop) 과 단점 상쇄선 (shortStop) 을 계산한다. 가격이 이 두 선을 넘으면 거래 신호를 낸다.
또한, 이 전략은 트렌드 방향을 판단하는 방향 변수를 도입했습니다.
            mylang

            direction = 1
direction := nz(direction[1], direction)
direction := direction == -1 and close > shortStopPrev ? 1 : direction == 1 and close < longStopPrev ? -1 : direction
방향이 1인 경우 다목적 경향에 있고, 방향이 -1인 경우 공허 경향에 있다.
방향 변수의 값에 따라 다른 색의 스톱 라인이 그려집니다:
            mylang

            if (direction == 1)
    valueToPlot := longStop
    colorToPlot := color.green
else
    valueToPlot := shortStop
    colorToPlot := color.red
이것은 현재 트렌드 방향과 스톱패스 라인의 위치를 명확하게 볼 수 있습니다.
손해 방지 메커니즘 추적
이 전략의 핵심은 가격운동에 따라 실시간으로 스톱 라인을 조정할 수 있는 추적 스톱 메커니즘을 도입한 것이다.
이 논리는 다음과 같습니다.
            mylang

            strategyPercentege = (close - updatedEntryPrice) / updatedEntryPrice * 100.00
rideUpStopLoss = hasOpenTrade() and strategyPercentege > 1

if (rideUpStopLoss)
    stopLossPercent := stopLossPercent + strategyPercentege - 1.0
    newStopLossPrice = updatedEntryPrice + (updatedEntryPrice * stopLossPercent) / 100
    stopLossPrice := max(stopLossPrice, newStopLossPrice)
    updatedEntryPrice := stopLossPrice
만약 가격이 입시 가격에 비해 1% 이상 상승하면 상향으로 추적하여 스톱 라인을 조정한다. 조정 폭이 1% 이상인 부분이다.
이 방법은 더 많은 수익을 확보하고 동시에 손실을 줄일 수 있습니다.
우위 분석
기존의 이동식 중지 전략에 비해, 이 전략의 가장 큰 장점은 시장 상황에 따라 동적으로 중지 라인을 조정할 수 있다는 것입니다. 구체적인 장점은 다음과 같습니다:
-
트렌드 상황에서 더 높은 수익을 고정할 수 있습니다.
트래킹 스톱 메커니즘은 스톱 라인을 지속적으로 이익 방향으로 움직일 수 있게 해 주며, 이는 시장이 계속 강세를 보인다면 더 높은 수익을 확보할 수 있게 해준다.
-
"이런 일이 벌어진다면, 우리가 어떻게 해야 할까요?"
시장 추세가 변할 때 고정된 이동 상쇄선은 쉽게 건너 뛸 수 있다. 이 전략의 상쇄선은 시장의 변동성을 기반으로 계산되어 가격 변화를 합리적으로 추적할 수 있으며, 상쇄시에 상쇄선이 건너 뛸 수 없다.
-
작동이 간단하고 자동화하기 쉽습니다.
이 전략은 전적으로 지표 운영에 기반하며, 복잡한 트렌드 판단 논리가 없습니다. 자동 거래는 매우 간단하게 구현할 수 있습니다.
-
다양한 품종에 맞는 사용자 정의 변수
ATR 주기, 확대 계수, 중지 범위 등의 파라미터는 사용자 정의 할 수 있으며, 다양한 품종의 파라미터를 위해 최적화 할 수 있으며, 전략을 더 보편적으로 사용할 수 있습니다.
위험 분석
이 전략은 장점이 많지만 다음과 같은 위험도 있습니다.
-
트렌드 전환점을 판단할 수 없고, 추세를 따라갈 위험이 있다.
이 전략은 트렌드가 종료되는지에 대한 논리를 판단하지 않습니다.
-
잘못된 변수 설정으로 손실이 커질 수 있습니다.
만약 ATR 주기 파라미터가 너무 짧게 설정되면, 스톱 라인은 너무 민감해지며, 흔들림 현상이 자주 유발될 수 있다.
-
이 글은 한 해에 한 번만 쓰면,
이 전략은 분양점을 스톱로즈지원점으로 고려하지 않는다. 따라서 짧은 선이 반발할 때 시장에서 쫓겨날 수도 있다.
위와 같은 위험에는 다음과 같은 측면에서 최적화할 수 있습니다.
-
트렌드 파동 지표와 결합하여, 트렌드 반전을 예측할 수 있습니다.
-
변수 최적화 테스트, 최적의 변수 조합을 선택
-
특정 지지점 근처의 폭넓은 중지 범위
최적화 방향
이 전략에는 더 많은 최적화 가능성이 있습니다:
-
K선 형태 판단과 결합
트렌드 반전의 가능성은 K선 모양의 전형적인 형태를 식별하여 판단할 수 있습니다. 이것은 고도를 추격하는 위험을 피할 수 있습니다.
-
동적 추적 파라미터를 최적화
ATR 주기, 확대 계수 등의 파라미터가 동적으로 변할 수 있으며, 크게 변동하는 시장에서 더 긴 ATR 주기와 더 넓은 손해 제한 범위를 사용합니다.
-
기계학습 모델과 결합된
lstm, rnn 등과 같은 딥러닝 모델을 통해 포스트시장의 가능한 가격 범위를 예측하고, 동적으로 스톱로스 거리를 조정한다.
요약하다
이 전략overall은 ATR 지표를 이용한 이동적 손실 라인을 설계하고, 손실을 추적하는 메커니즘을 도입하여, 시장상황 변화에 따라 실시간으로 손실 위치를 조정할 수 있다. 이것은 더 높은 수익 잠금을 실현하면서도 위험을 줄여준다. 추가적인 최적화를 통해 이 전략은 시장의 다양한 상황에 더 잘 적응할 수 있게 하여, 유연성이 강한 거래 전략이 된다.
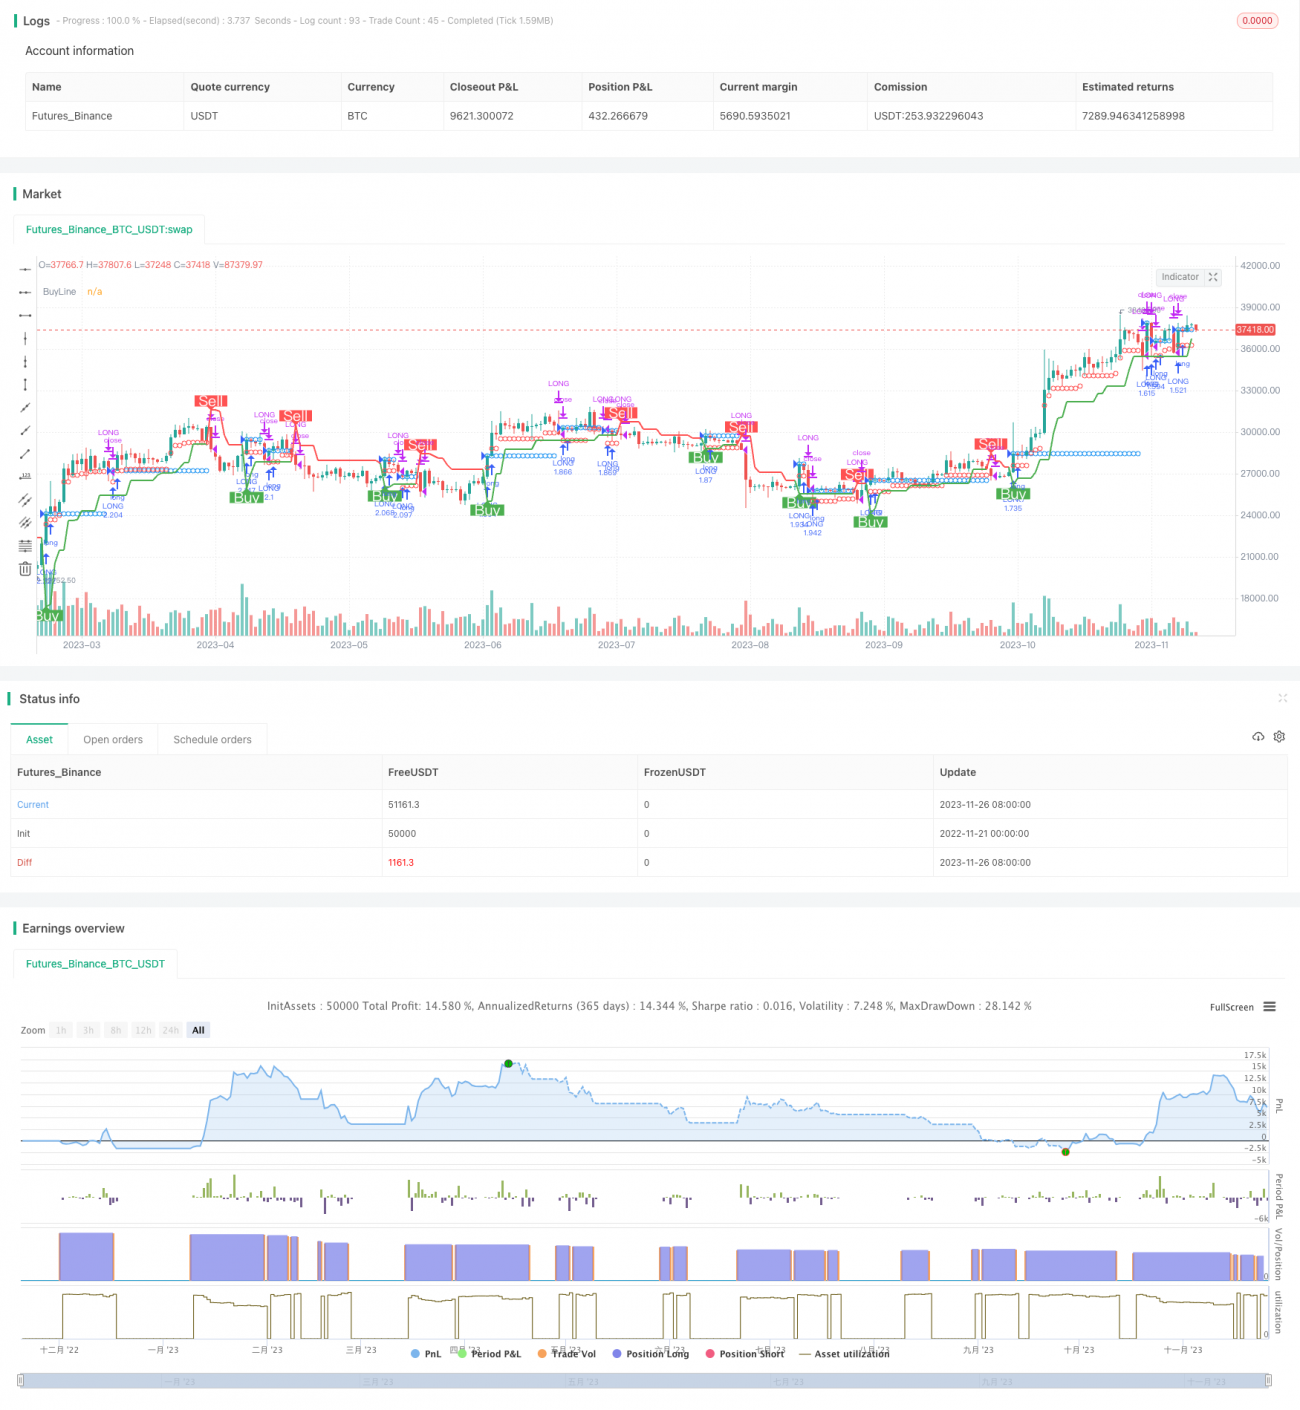
/*backtest
start: 2022-11-21 00:00:00
end: 2023-11-27 00:00:00
period: 1d
basePeriod: 1h
exchanges: [{"eid":"Futures_Binance","currency":"BTC_USDT"}]
*/

//@version=4
//
// ▒▒▒▒▒▒▒▒▒▒▒▒▒▒▒▒▒▒▒▒▒▒▒▒▒▒▒▒▒▒▒▒▒▒▒▒▒▒▒▒▒▒▒▒▒▒▒▒▒▒▒▒▒▒▒▒▒▒▒▒▒▒▒▒▒▒▒▒▒▒▒▒▒▒▒▒▒▒▒▒▒▒▒▒▒▒▒▒▒▒▒▒▒▒▒▒▒▒▒▒▒▒▒▒▒▒▒▒▒▒▒▒▒▒
// ------------------------------------------------------------------------------ 1