RSI 이동평균을 기반으로 한 단기 양적 거래 전략으로 저가 매수 고가 매도

1
Follow
1778
Followers
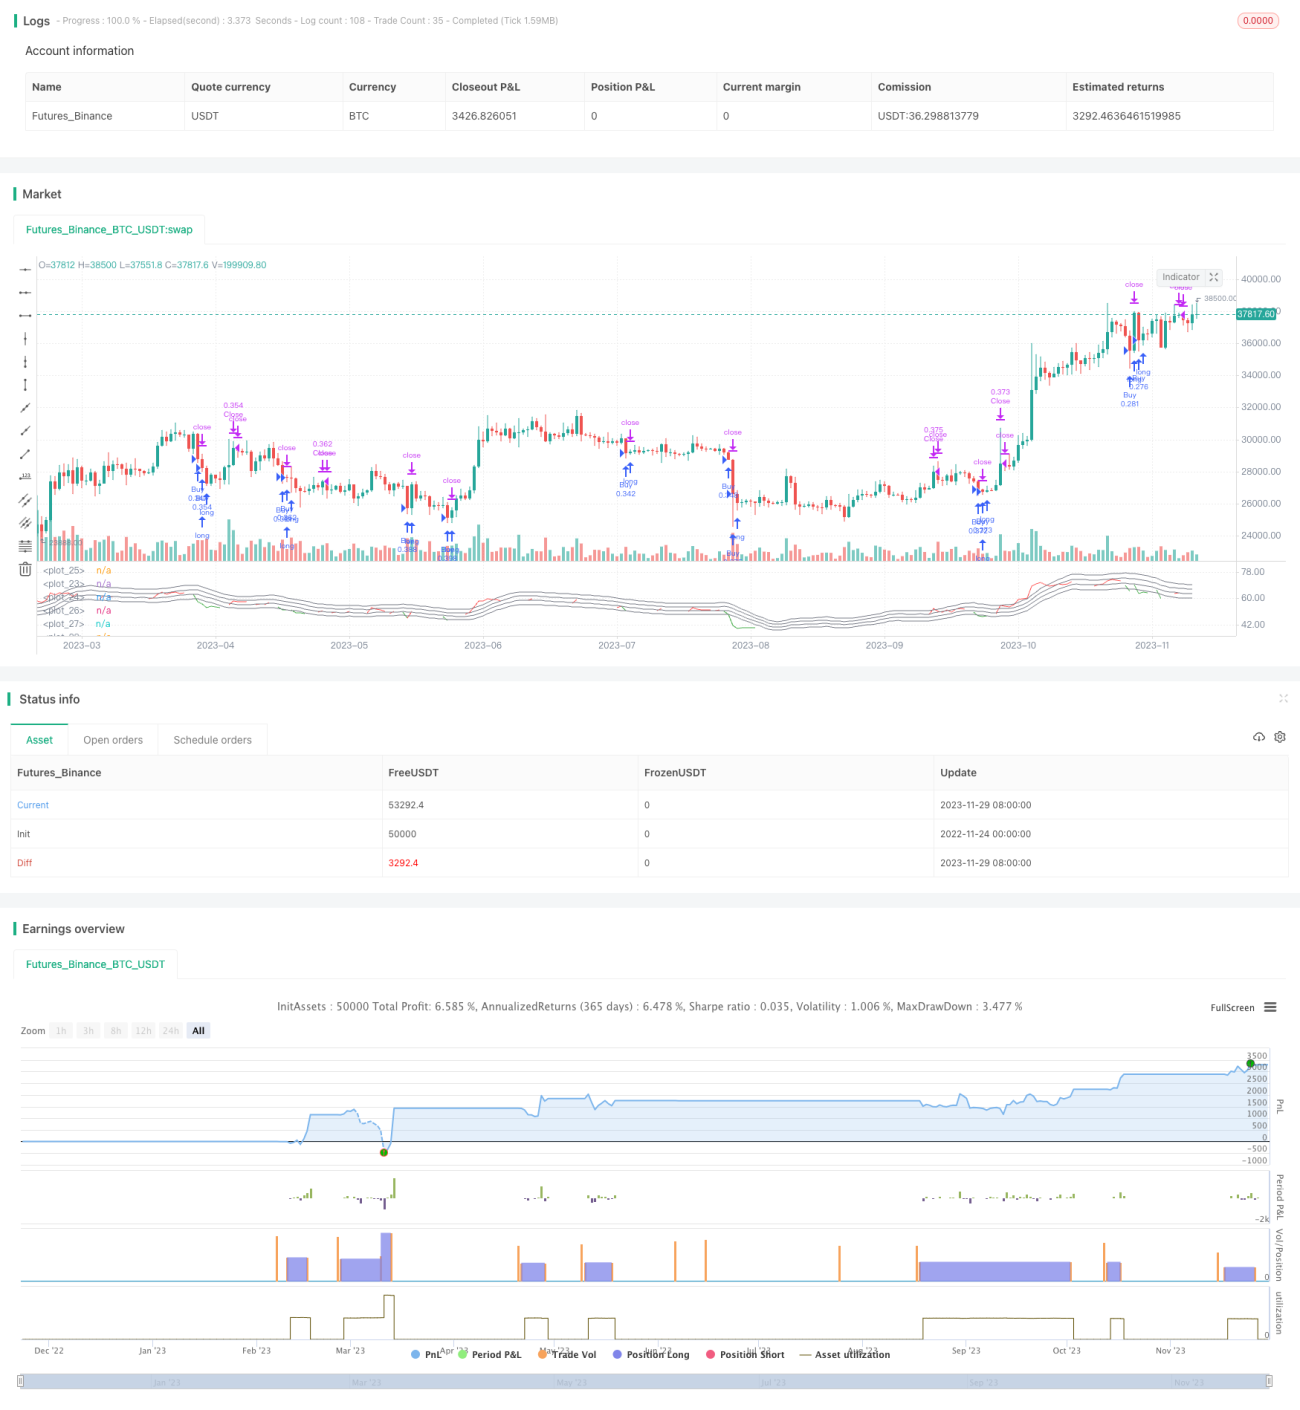
개요
이 전략은 RSI 지표와 그 평균선의 교차를 통해 매매점을 결정하며, 단선 거래 전략에 속한다. 이 전략은 RSI 지표가 그 평균선보다 낮을 때 구매하고, 그 평균선보다 높을 때 판매하며, 전형적인 낮은 가격으로 높은 가격으로 판매하는 전략에 속한다.
전략 원칙
- RSI를 계산합니다. 주기는 40 K선입니다.
- RSI 지표에 대한 MA 평균선 계산, 주기의 길이는 10 K 선
- RSI 지표가 평균선보다 낮을 때 구매 신호를 생성하는 계수 ((1-매매 간격/100)
- RSI 지표가 평균보다 높을 때 매매 신호를 생성합니다.
- 구매/판매 구간 간격이 기본으로 5인 경우, 평균선에서 ±5% 떨어져서 신호가 발생한다.
- RSI 지표가 평균보다 높고 50 수준 이상으로 평형 지점을 판단할 때
우위 분석
이것은 전형적인 트렌드 리버스 전략으로 RSI 지표의 오버 바이 오버 셀 특성을 이용해서 구매 시점을 결정한다. 이 전략에는 다음과 같은 장점이 있다:
- RSI 지표를 사용하여 시장 구조를 판단하고, 지표 자체는 신뢰성이 높습니다.
- 일선 필터링은 불필요한 거래를 방지하고 안정성을 강화합니다.
- 거래 빈도를 조정할 수 있는 거래 구역 간격 변수
- 코드는 간단하고 이해하기 쉬우며, 논리가 명확합니다.
전체적으로 볼 때, 이것은 간단하고 실용적인 단선 거래 전략입니다.
위험 분석
이 전략에는 몇 가지 위험도 있습니다.
- RSI 지표가 잘못된 신호를 발산할 가능성이 높으며, 지표 곡선의 형태에 주의를 기울여야 합니다.
- 구매 및 판매 간격이 잘못 설정되면 거래가 너무 많거나 기회를 놓치게 될 수 있습니다.
- 거래 빈도가 높기 때문에 거래 비용의 영향을 고려해야 합니다.
- 단 하나의 지표에 기반하여 시장의 변동에 취약하다.
이러한 위험은 매개 변수 최적화, 필터링 조건을 추가하는 등의 방법으로 완화될 수 있다.
최적화 방향
이 전략은 다음과 같은 차원에서 최적화될 수 있습니다.
- 거래량 지표와 같은 더 많은 필터링 지표를 추가하여 트렌드 전환점에서만 신호를 생성하도록합니다.
- 단독 손실을 통제하기 위한 HAL 전략에 참여하세요.
- 거래 거리를 최적화하고 거래 빈도와 수익률을 균형 잡는다.
- 기계 학습 알고리즘을 사용하여 우수 변수 조합을 자동으로 찾습니다.
- 포괄 모형을 추가하여 여러 하위 전략 결과를 통합합니다.
다중 지표 조합, 손해 관리, 변수 최적화 등의 수단으로 전략 성과를 크게 향상시킬 수 있다.
요약하다
이 전략은 전체적으로 매우 전형적이고 실용적인 짧은 라인 거래 전략이다. RSI 지표의 오버 바이 오버 셀 상태를 사용하여 매매 시기를 판단하고, 평평한 필터링으로 보조한다. 전략 논리는 간단하고 명확하며, 매개 변수를 조정하는 것은 유연하며, 구현하기 쉽다.
Source
Pine
Strategy parameters
Related strategies
Comment
All comments (0)
No data
- 1