
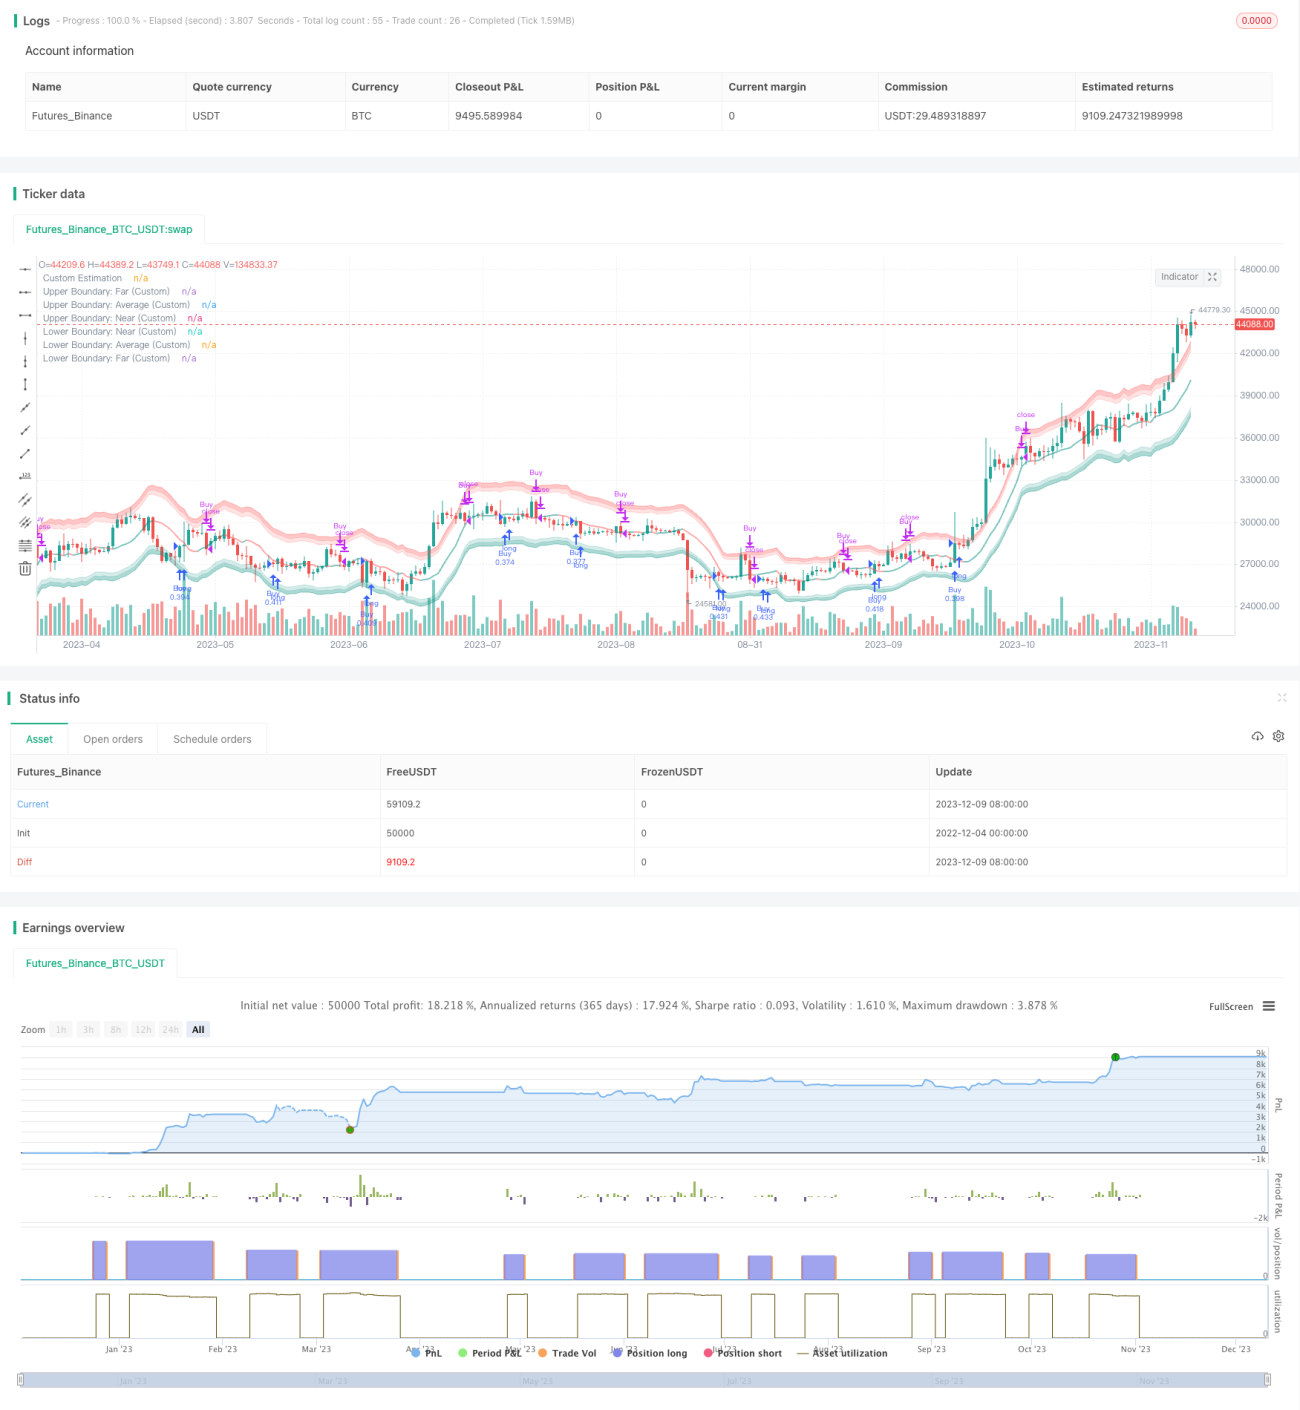
이 전략은 Nadaraya-Watson 핵 회귀 방법에 기초하여 동적 변동률 포괄대를 구성하여 가격과 포괄带의 교차 상황을 추적하여 낮은 가격과 높은 가격의 거래 신호를 구현합니다. 이 전략은 수학 분석 기반을 가지고 있으며 시장 변화에 적응 할 수 있습니다.
전략의 핵심은 가격의 동적 포위대를 계산하는 것이다. 먼저, 사용자 정의된 회전 기간에 따라 가격 ((폐쇄 가격, 최고 가격, 최저 가격) 을 구성하는 나다라야-왓슨 핵 회귀 곡선을 구성하여 평형화된 가격 추정치를 얻는다. 그리고 사용자 정의된 ATR 길이를 기반으로 ATR 지수를 계산하여 근위 인자와 원위 인자를 결합하여 상하 포위대의 범위를 얻는다. 가격이 하위 포위대에서 상하 포위대로 침입하면 구매 신호를 발생시키고; 가격이 상하 포위대에서 상하 포위대에서 상하 포위대에서 벗어날 때 판매 신호를 발생시킨다. 이 전략은 가격의 변동률과 관련된 통계적 특성을 통해 거래 결정을 동적으로 조정한다.
이러한 위험을 피하고 줄이는 방법은 주로 매개 변수를 최적화하고, 재검토를 잘하고, 영향을 미치는 요소를 이해하고, 신중한 실판을 사용하는 것입니다.
이 전략은 통계 분석과 기술 지표 분석을 통합하여 가격과 변동률을 동적으로 추적하여 낮은 가격과 높은 가격의 거래 신호를 구현합니다. 시장과 자신의 상황에 따라 파라미터를 조정할 수 있습니다. 전체적으로 전략 이론적 기반은 견고하며 실제 성능은 추가 검증되어야합니다. 신중하게 관찰하고 신중하게 실적을 조사해야합니다.
/*backtest
start: 2022-12-04 00:00:00
end: 2023-12-10 00:00:00
period: 1d
basePeriod: 1h
exchanges: [{"eid":"Futures_Binance","currency":"BTC_USDT"}]
*/
// © Julien_Eche
//@version=5
strategy("Nadaraya-Watson Envelope Strategy", overlay=true, pyramiding=1, default_qty_type=strategy.percent_of_equity, default_qty_value=20)
// Helper Functions
getEnvelopeBounds(_atr, _nearFactor, _farFactor, _envelope) =>
_upperFar = _envelope + _farFactor*_atr
_upperNear = _envelope + _nearFactor*_atr
_lowerNear = _envelope - _nearFactor*_atr
_lowerFar = _envelope - _farFactor*_atr
_upperAvg = (_upperFar + _upperNear) / 2
_lowerAvg = (_lowerFar + _lowerNear) / 2
[_upperNear, _upperFar, _upperAvg, _lowerNear, _lowerFar, _lowerAvg]
customATR(length, _high, _low, _close) =>
trueRange = na(_high[1])? math.log(_high)-math.log(_low) : math.max(math.max(math.log(_high) - math.log(_low), math.abs(math.log(_high) - math.log(_close[1]))), math.abs(math.log(_low) - math.log(_close[1])))
ta.rma(trueRange, length)
customKernel(x, h, alpha, x_0) =>
sumWeights = 0.0
sumXWeights = 0.0
for i = 0 to h
weight = math.pow(1 + (math.pow((x_0 - i), 2) / (2 * alpha * h * h)), -alpha)
sumWeights := sumWeights + weight
sumXWeights := sumXWeights + weight * x[i]
sumXWeights / sumWeights
// Custom Settings
customLookbackWindow = input.int(8, 'Lookback Window (Custom)', group='Custom Settings')
customRelativeWeighting = input.float(8., 'Relative Weighting (Custom)', step=0.25, group='Custom Settings')
customStartRegressionBar = input.int(25, "Start Regression at Bar (Custom)", group='Custom Settings')
// Envelope Calculations
customEnvelopeClose = math.exp(customKernel(math.log(close), customLookbackWindow, customRelativeWeighting, customStartRegressionBar))
customEnvelopeHigh = math.exp(customKernel(math.log(high), customLookbackWindow, customRelativeWeighting, customStartRegressionBar))
customEnvelopeLow = math.exp(customKernel(math.log(low), customLookbackWindow, customRelativeWeighting, customStartRegressionBar))
customEnvelope = customEnvelopeClose
customATRLength = input.int(60, 'ATR Length (Custom)', minval=1, group='Custom Settings')
customATR = customATR(customATRLength, customEnvelopeHigh, customEnvelopeLow, customEnvelopeClose)
customNearATRFactor = input.float(1.5, 'Near ATR Factor (Custom)', minval=0.5, step=0.25, group='Custom Settings')
customFarATRFactor = input.float(2.0, 'Far ATR Factor (Custom)', minval=1.0, step=0.25, group='Custom Settings')
[customUpperNear, customUpperFar, customUpperAvg, customLowerNear, customLowerFar, customLowerAvg] = getEnvelopeBounds(customATR, customNearATRFactor, customFarATRFactor, math.log(customEnvelopeClose))
// Colors
customUpperBoundaryColorFar = color.new(color.red, 60)
customUpperBoundaryColorNear = color.new(color.red, 80)
customBullishEstimatorColor = color.new(color.teal, 50)
customBearishEstimatorColor = color.new(color.red, 50)
customLowerBoundaryColorNear = color.new(color.teal, 80)
customLowerBoundaryColorFar = color.new(color.teal, 60)
// Plots
customUpperBoundaryFar = plot(math.exp(customUpperFar), color=customUpperBoundaryColorFar, title='Upper Boundary: Far (Custom)')
customUpperBoundaryAvg = plot(math.exp(customUpperAvg), color=customUpperBoundaryColorNear, title='Upper Boundary: Average (Custom)')
customUpperBoundaryNear = plot(math.exp(customUpperNear), color=customUpperBoundaryColorNear, title='Upper Boundary: Near (Custom)')
customEstimationPlot = plot(customEnvelopeClose, color=customEnvelope > customEnvelope[1] ? customBullishEstimatorColor : customBearishEstimatorColor, linewidth=2, title='Custom Estimation')
customLowerBoundaryNear = plot(math.exp(customLowerNear), color=customLowerBoundaryColorNear, title='Lower Boundary: Near (Custom)')
customLowerBoundaryAvg = plot(math.exp(customLowerAvg), color=customLowerBoundaryColorNear, title='Lower Boundary: Average (Custom)')
customLowerBoundaryFar = plot(math.exp(customLowerFar), color=customLowerBoundaryColorFar, title='Lower Boundary: Far (Custom)')
// Fills
fill(customUpperBoundaryFar, customUpperBoundaryAvg, color=customUpperBoundaryColorFar, title='Upper Boundary: Farmost Region (Custom)')
fill(customUpperBoundaryNear, customUpperBoundaryAvg, color=customUpperBoundaryColorNear, title='Upper Boundary: Nearmost Region (Custom)')
fill(customLowerBoundaryNear, customLowerBoundaryAvg, color=customLowerBoundaryColorNear, title='Lower Boundary: Nearmost Region (Custom)')
fill(customLowerBoundaryFar, customLowerBoundaryAvg, color=customLowerBoundaryColorFar, title='Lower Boundary: Farmost Region (Custom)')
longCondition = ta.crossover(close, customEnvelopeLow)
if (longCondition)
strategy.entry("Buy", strategy.long)
exitLongCondition = ta.crossover(customEnvelopeHigh, close)
if (exitLongCondition)
strategy.close("Buy")