노로 변동성 채널 스캘핑 전략

개요
노로의 가격 채널 스칼핑 전략 (Noro's Price Channel Scalping Strategy) 은 가격 채널과 가격 변동대를 기반으로 한 스칼핑 거래 전략이다. 이 전략은 가격 채널과 가격 변동으로 인한 시장 추세를 식별하고 추세 방향이 변할 때 입찰한다.
전략 원칙
이 전략은 우선 가격의 최상위 가격 채널 ((lasthigh) 과 최저 가격 채널 ((lastlow) 을 계산하고, 가격 채널의 중선을 ((center) 을 계산한다. 다음으로 가격과 중선의 거리를 ((dist) 과 거리의 간단한 이동 평균 ((distsma) 을 계산한다. 이를 바탕으로 중선 거리의 1배 ((hd와ld) 와 2배 ((hd2와ld2) 의 가격 변동대를 계산할 수 있다.
가격이 위쪽에서 중선 1배의 변동대를 통과했을 때 낙점으로 판단하고, 가격이 아래쪽에서 중선 1배의 변동대를 통과했을 때 낙점으로 판단한다. 전략은 쇠퇴의 징후가 나타날 때 역으로 포지션을 열는다. 예를 들어, 낙점의 추세에서 두 개의 양선이 나타나면 두 번째 양선이 닫힐 때 공백을 한다. 낙점의 추세에서 두 개의 음선이 나타나면 두 번째 음선이 닫힐 때 더 많이 한다.
전략적 이점
- 가격 통로를 사용하여 시장의 방향을 판단하여 잘못된 거래를 피하십시오.
- 가격 변동에 따라 추세가 쇠퇴했는지 판단하고, 전환점을 정확하게 파악합니다.
- 스칼핑을 통해 빠르게 수익을 창출하세요.
전략적 위험
- 가격 변동이 큰 경우, 가격 통로와 변동대가 작동하지 않을 수 있습니다.
- 스칼핑 거래는 높은 거래 빈도를 필요로 하며 거래 비용과 슬립 포인트 위험을 증가시킬 수 있습니다.
- 손실 위험을 통제하기 위해 손실을 막는 전략을 충분히 고려해야 합니다.
전략 최적화
- 가격 통로 및 변동의 변수를 최적화하여 시장 상황에 더 잘 적응합니다.
- 다른 지표들과 함께 추세와 전환점을 판단하는 것
- 더 많은 손실을 막는 전략
- 거래 비용과 슬라이드 포인트의 영향을 고려합니다.
요약하다
노로 파동 채널 스칼핑 전략은 전체적으로 스칼핑 거래에 매우 적합한 전략이다. 가격 채널과 변동 영역을 사용하여 시장의 움직임을 판단하고 상위 또는 하위 신호가 나타나면 역으로 입장을 열는다. 이 전략은 거래 빈도가 높고 수익이 빠르게 이루어지지만 약간의 위험에 직면합니다. 추가적인 최적화를 통해이 전략은 더 많은 다른 시장에 적용 할 수 있습니다.
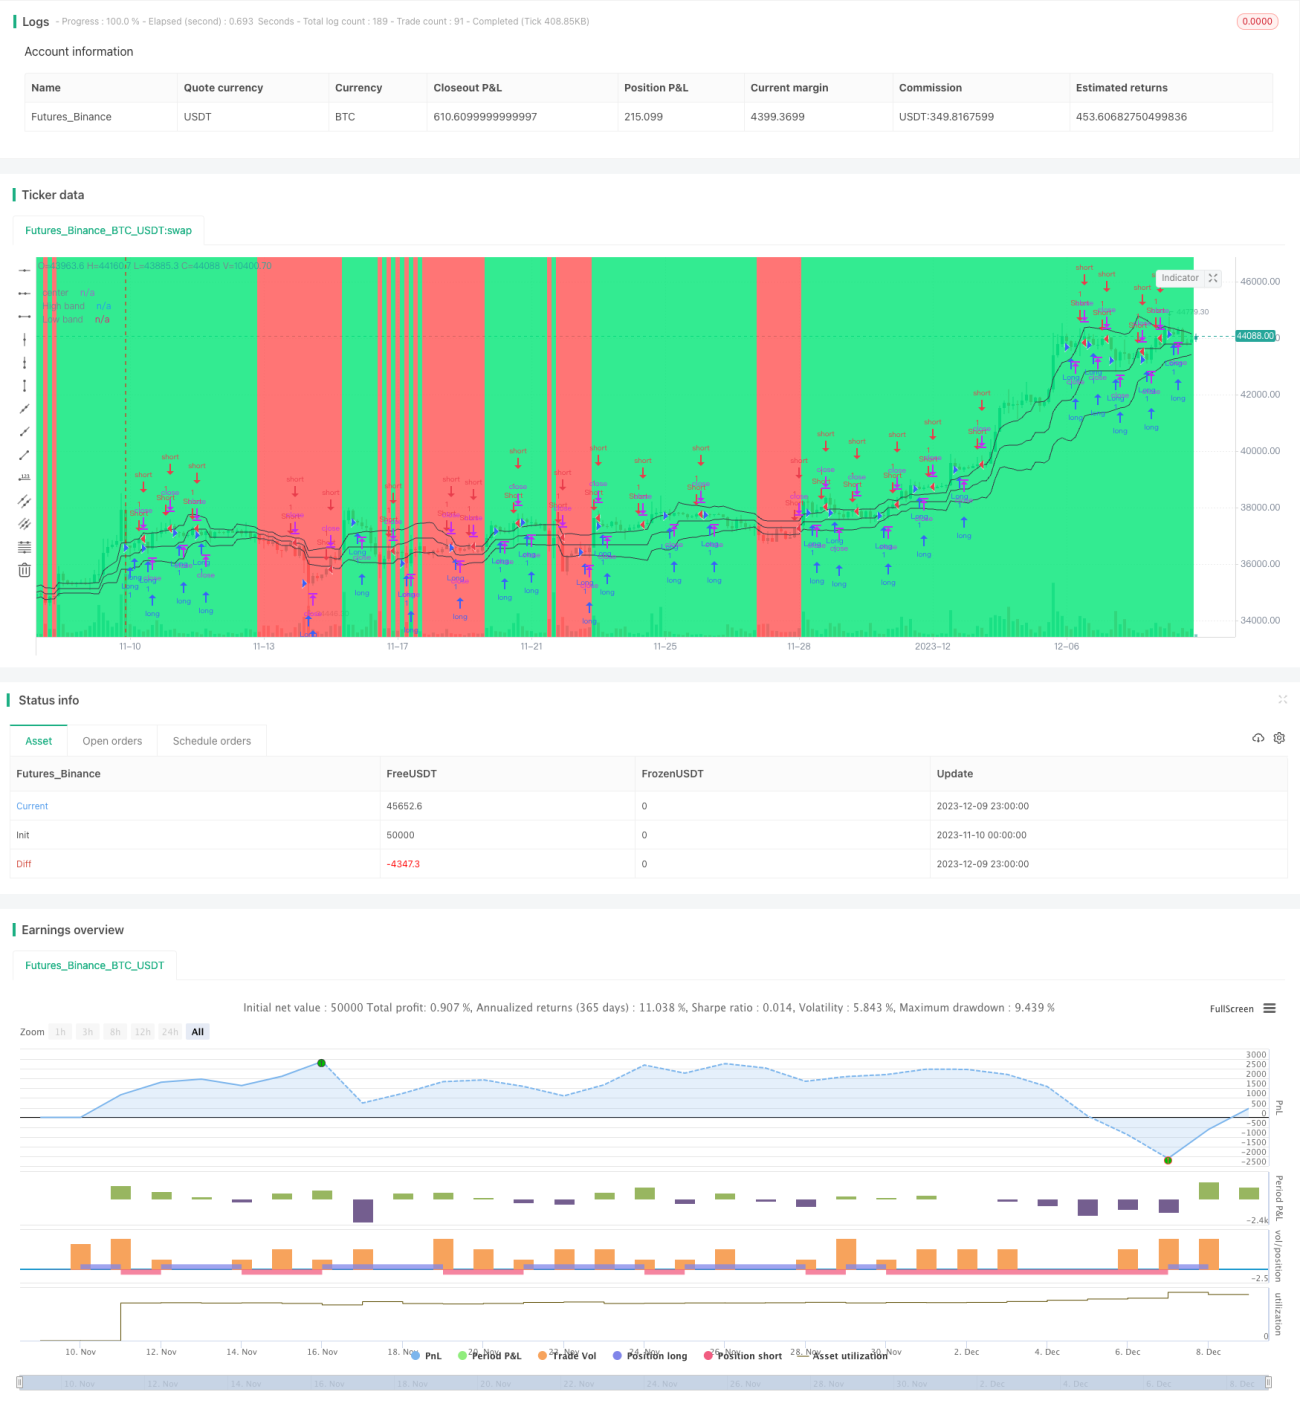
/*backtest
start: 2023-11-10 00:00:00
end: 2023-12-10 00:00:00
period: 3h
basePeriod: 15m
exchanges: [{"eid":"Futures_Binance","currency":"BTC_USDT"}]
*/


//@version=2
strategy("Noro's Bands Scalper Strategy v1.0", shorttitle = "Scalper str 1.0", overlay=true, default_qty_type = strategy.percent_of_equity, default_qty_value=100.0, pyramiding=0)
- 1