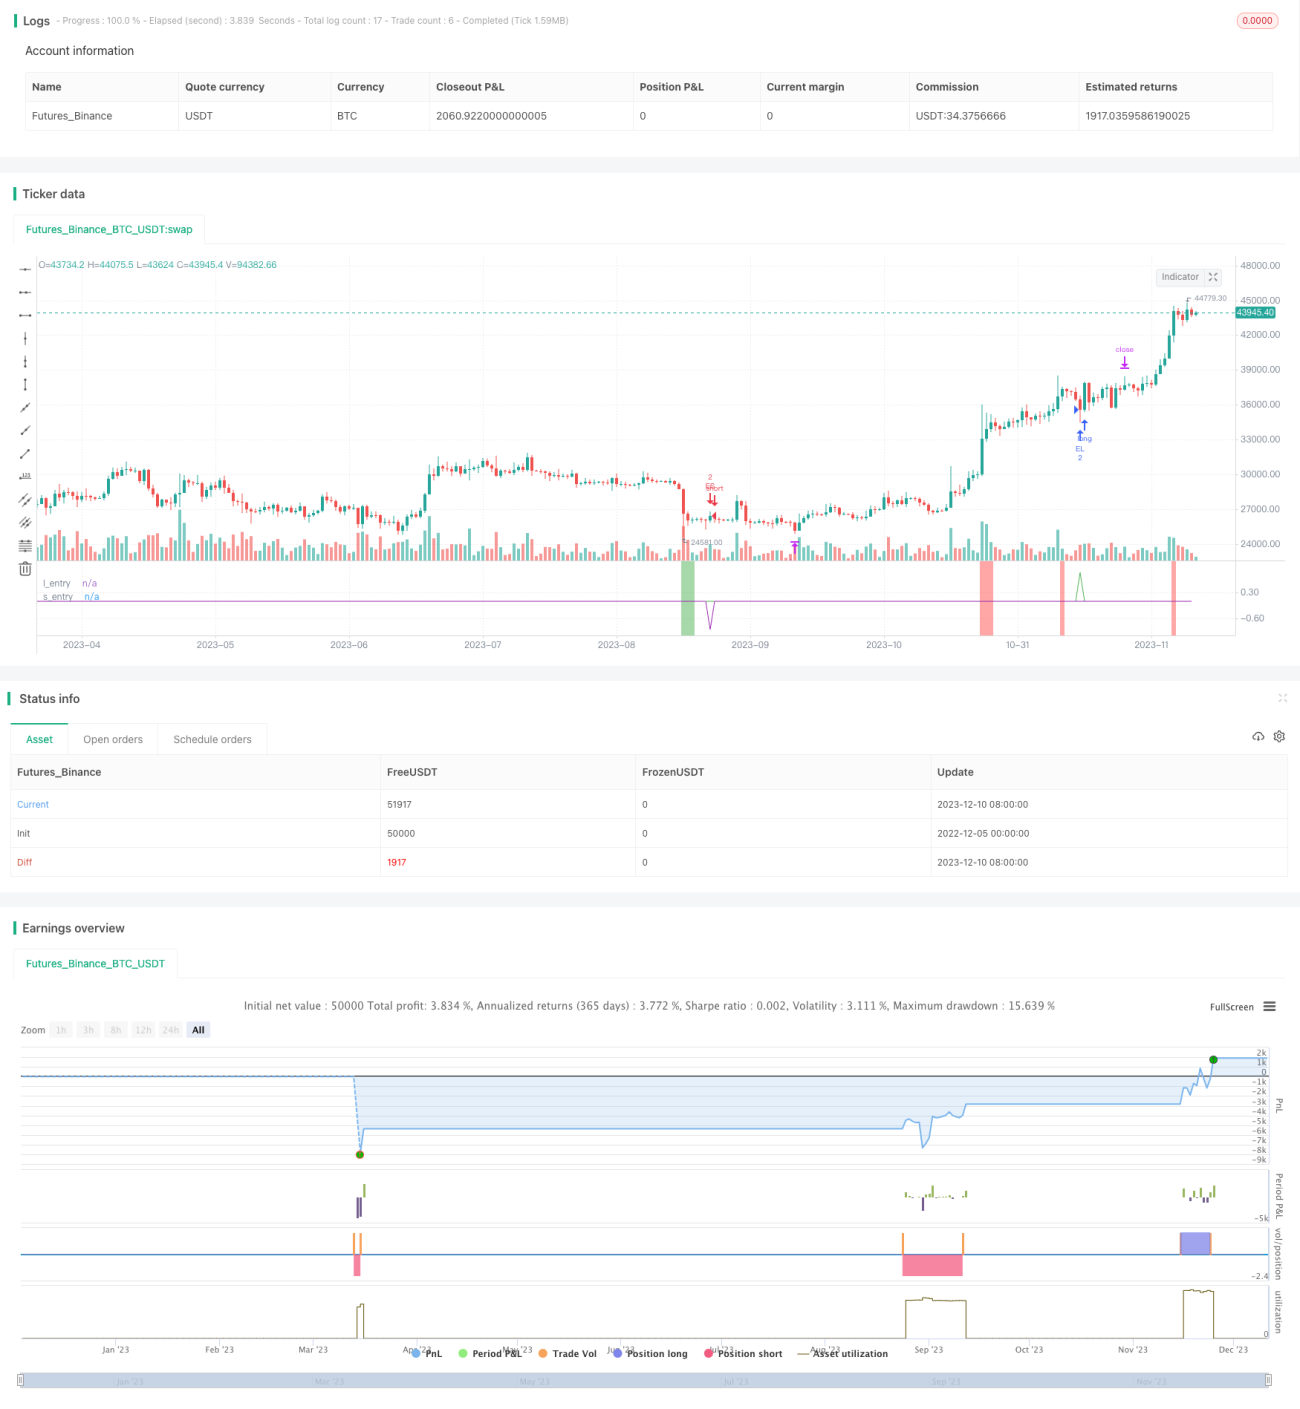
모멘텀 풀백 전략

저자:차오장, 날짜: 2023-12-12 16:34:52
태그:

img

전반적인 설명

모멘텀 풀백 전략은 극단적인 RSI 판독을 장기/단기 전략의 모멘텀 신호로 식별합니다. 대부분의 RSI 전략과 달리, 극단적인 RSI 판독 방향으로 첫 번째 풀백을 구매하거나 판매하는 것으로 보입니다.

5주기 EMA (하위) / 5주기 EMA (고위) 의 첫 번째 인회에서 장/단으로 들어가고 12바르의 고위/하위에서 빠져 나간다. 롤링 고위/하위 특징은 가격이 장기적인 통합에 들어가면 새로운 바마다 수익 목표가 감소하기 시작할 것이라는 것을 의미합니다. 최고의 거래는 2-6 바 내에서 작동하는 경향이 있습니다.

제안된 스톱 로스는 입시 가격에서 X ATR (인पुट에서 조정) 입니다.

이 전략은 60%~70%의 승률과 더 큰 승리 트레이드와 함께 시간 프레임과 시장에 걸쳐 상당히 견고합니다. 뉴스 변동성에서 발생하는 신호는 피해야합니다.

전략 논리

  1. 6주기 RSI를 계산하고 90 (가장 구매) 이상과 10 (가장 판매) 이하의 값을 식별합니다.

  2. RSI가 과잉 인수되면 6 바 내로 5 기간 EMA (하위) 로 인하를 위해 장거리 가십시오.

  3. RSI가 과잉 판매되면 6 바 내로 5 기간 EMA (고위) 로 인하를 위해 단축합니다.

  4. 출구 전략은 이동 수익을 취하고, 초기 목표는 지난 12 바의 가장 높은 최고 / 가장 낮은 최저로, 롤링 출구에 대한 새로운 바마다 업데이트됩니다.

  5. 스톱 로스는 입시 가격의 ATR X입니다.

이점 분석

이 전략은 RSI 극한을 모멘텀 신호와 풀백 엔트리로 결합하여 높은 승률으로 트렌드의 잠재적 역전 지점을 포착합니다.

이동 수익 메커니즘은 실제 가격 움직임에 따라 부분 수익을 잠금하고 인출을 줄입니다.

ATR 스톱은 단일 거래 손실을 효과적으로 제어하는 데 도움이 됩니다.

다른 시장과 매개 변수 세트에서 적용할 수 있는 좋은 안정성, 실제 거래 복제를 쉽게 하기 위해.

위험 분석

ATR 곱셈값이 너무 높으면 너무 넓은 스톱 로스, 거래당 손실을 증가시킵니다.

이윤 취득 메커니즘의 이동은 장기적인 통합이 발생하면 이윤 마진을 줄일 수 있습니다.

6바를 넘어서면 트레이드를 놓칠 수 있습니다.

주요 뉴스 사건이 발생하면 잠재적인 미끄러짐 또는 거짓 파업.

최적화 방향

테스트 입력 바 수를 6에서 4로 줄여 입력 속도를 향상시킵니다.

트레이드당 더 많은 제어 손실을 위해 ATR 곱셈을 증가시키는 테스트.

부피 지표를 포함하여 통합에서 분산으로 인한 손실을 피합니다.

소음을 필터링하기 위해 중점 60분 후의 후퇴 휴식기를 입력합니다.

결론

모멘텀 풀백 전략 (Momentum Pullback Strategy) 은 트렌드, 역전 및 리스크 관리 요소를 통합하여 알파 생성 잠재력을 가지고 있으면서도 쉬운 실제 거래를위한 전반적으로 매우 실용적인 단기 평균 반전 접근법입니다. 매개 변수 조정 및 추가 지표를 결합함으로써 더 많은 안정성 향상이 가능합니다. 양자 거래에 큰 혜택을 제공하며 학습 및 적용 가치가 있습니다.


/*backtest
start: 2022-12-05 00:00:00
end: 2023-12-11 00:00:00
period: 1d
basePeriod: 1h
exchanges: [{"eid":"Futures_Binance","currency":"BTC_USDT"}]
*/

// This source code is subject to the terms of the Mozilla Public License 2.0 at https://mozilla.org/MPL/2.0/
// © Marcns_

//@version=5
strategy("M0PB", commission_value = 0.0004, slippage = 1, initial_capital=30000)
// commision is equal to approx $3.8 per round trip which is accurate for ES1! futures and slippage per trade is conservatively 1 tick in and 1 tick out. 

// *momentum pull back* //

// long / short strategy that identifies extreme readings on the rsi as a *momentum signal*
//Strategy buys/ sells a pullback to the 5ema(low)/ 5ema(high) and exits at rolling 12 bar high/ low. The rolling high/ low feature means that 
//if price enters into a pronlonged consolidation the profit target will begin to reduce with each new bar. The best trades tend to work within 2-6 bars
// hard stop is X atr's from postion average price. This can be adjusted in user inputs.
// built for use on 5 min & 1min intervals on: FX, Indexes, Crypto
// there is a lot of slack left in entries and exits but the overall strategy is fairly robust across timeframes and markets and has between 60%-70% winrate with larger winners.
// signals that occur from economic news volatility are best avoided.  


// define rsi
r = ta.rsi(close,6) 

// find rsi > 90
b = 0.0

if r >= 90
    b := 1.0
else
    na

// find rsi < 10
s = 0.0

if r <= 10
    s := -1.0
else
    na

// plot rsi extreme as painted background color
bgcolor(b ? color.rgb(255, 82, 82, 49): na)
bgcolor(s? color.rgb(76, 175, 79, 51): na)


// exponential moving averages for entries. note that source is high and low (normally close is def input) this creates entry bands
//entry short price using high as a source ta.ema(high,5)
es = ta.ema(high,5)

//entry long price using low as a source ta.ema(low,5)
el = ta.ema(low,5)


// long pullback entry trigger: last period above ema and current low below target ema entry 
let = 0.0

if low[1] > el[1] and low <= el
    let := 1.0
else
    na
//short entry trigger ""
set = 0.0

if high[1] < es[1] and high >= es
    set := -1.0
else
    na

// create signal "trade_l" if RSI > 90 and price pulls back to 5ema(low) within 6 bars
trade_l = 0.0

if ta.barssince(b == 1.0) < 6 and let == 1.0
    trade_l := 1.0
else
    na

plot(trade_l, "l_entry", color.green)

//create short signal "trade_s" if rsi < 10 and prices pullback to 5em(high) wihthin 6 bars
trade_s = 0.0

if ta.barssince(s == -1.0) < 6 and set == -1.0
    trade_s := -1.0
else
    na

plot(trade_s, "s_entry", color.purple)

// define price at time of trade_l signal and input value into trade_p to use for stop parems later
trade_p = strategy.position_avg_price

//indentify previous 12 bar high as part of long exit strat
// this creates a rolling 12 bar high target... a quick move back up will exit at previous swing high but if a consolidation occurs system will exit on a new 12 bar high which may be below prev local high
ph = ta.highest(12)

// inverse of above for short exit strat - previous lowest low of 12 bars as exit (rolling)
pl = ta.lowest(12)


// 1.5 atr stop below entry price (trade_p defined earlier) as part of exit strat
atr_inp = input.float(2.75, "atr stop", minval = 0.1, maxval = 6.0)

atr = ta.atr(10)

stop_l = trade_p - (atr* atr_inp)
stop_s = trade_p + (atr* atr_inp)

//strat entry long

strategy.entry("EL", strategy.long, 2, when = trade_l == 1.0)

//strat entry short

strategy.entry("ES", strategy.short, 2, when = trade_s == -1.0)   
    
//strat long exit

if strategy.position_size == 2
    strategy.exit(id = "ph", from_entry = "EL", qty = 2, limit = ph)
    if strategy.position_size == 2
        strategy.close_all(when = low[1] > stop_l[1] and low <= stop_l)

// strat short exit

if strategy.position_size == -2
    strategy.exit(id = "pl", from_entry = "ES", qty = 2, limit =pl)
    if strategy.position_size == -2
        strategy.close_all(when = high[1] < stop_s[1] and high >= stop_s)


// code below to trail remaining 50% of position //

 //if strategy.position_size == 1 
        //strategy.exit(id ="trail", from_entry = "EL", qty = 1, stop = el)


더 많은