
이 전략은 가격 흐름을 판단하는 긴 선 트렌드 추적 전략이다. 그것은 역사적 가격의 분화점을 계산하여 마지막 분화점의 돌파구를 판단하여 입장을 결정한다. 동시에, 그것은 마지막 N 분화점의 평균 가격을 계산하여 트렌드 방향을 판단하고, 트렌드가 전환할 때 평소 입장을한다.
분기점 기반의 트렌드를 판단하는 이 전략의 가장 큰 장점은 시장 소음을 효과적으로 필터링하여 더 긴 선의 트렌드 방향을 판단할 수 있다는 것입니다. 간단한 이동 평균과 같은 지표에 비해 갑작스러운 비정상적인 변동에 대한 저항력이 더 강합니다.
또한, 이 전략은 포지션 구축 및 포지션 기준을 매우 명확하게 판단하고, 빈번한 거래 문제가 발생하지 않습니다. 이것은 또한 긴 라인 보유에 특히 적합합니다.
이 전략의 가장 큰 위험은 분화점 자체의 판단의 확률성이다. 분화점은 가격이 반드시 반전될 것을 100% 예측할 수 없으므로, 잘못된 판단의 확률이 여전히 존재한다. 잘못된 판단이 발생하면 손실의 위험에 직면하게 된다.
또한, 분화점 판단의 시간 범위가 길기 때문에 고주파 거래에 적합하지 않다. 단선 거래를 추구할 경우 이 전략은 그다지 적합하지 않다.
분모점 판단의 오류 확률을 고려하여 다음과 같은 방법으로 최적화할 수 있습니다.
다른 지표 확인과 결합하여, 예를 들어, 블린 라인 채널, 이동 평균 등, 단일 분기점 판단 오류를 피한다.
판별의 전후주 수와 같은 분화점의 매개 변수를 조정하여 분화점의 판정을 최적화한다.
손실이 어느 정도까지 확대될 때 손실을 막는 전략을 강화한다.
이 획기적인 분화 전략은 전체적으로 긴 선의 추세를 판단하는 데 적합하며 긴 선의 투자자가 사용하는 데 적합합니다. 우리는 판단의 정확성을 보장하는 전제로만 파라미터를 적절히 조정하고 다른 필터 지표를 추가하면이 전략을 크게 최적화하여 양적 의사 결정의 중요한 구성 요소로 만들 수 있습니다.
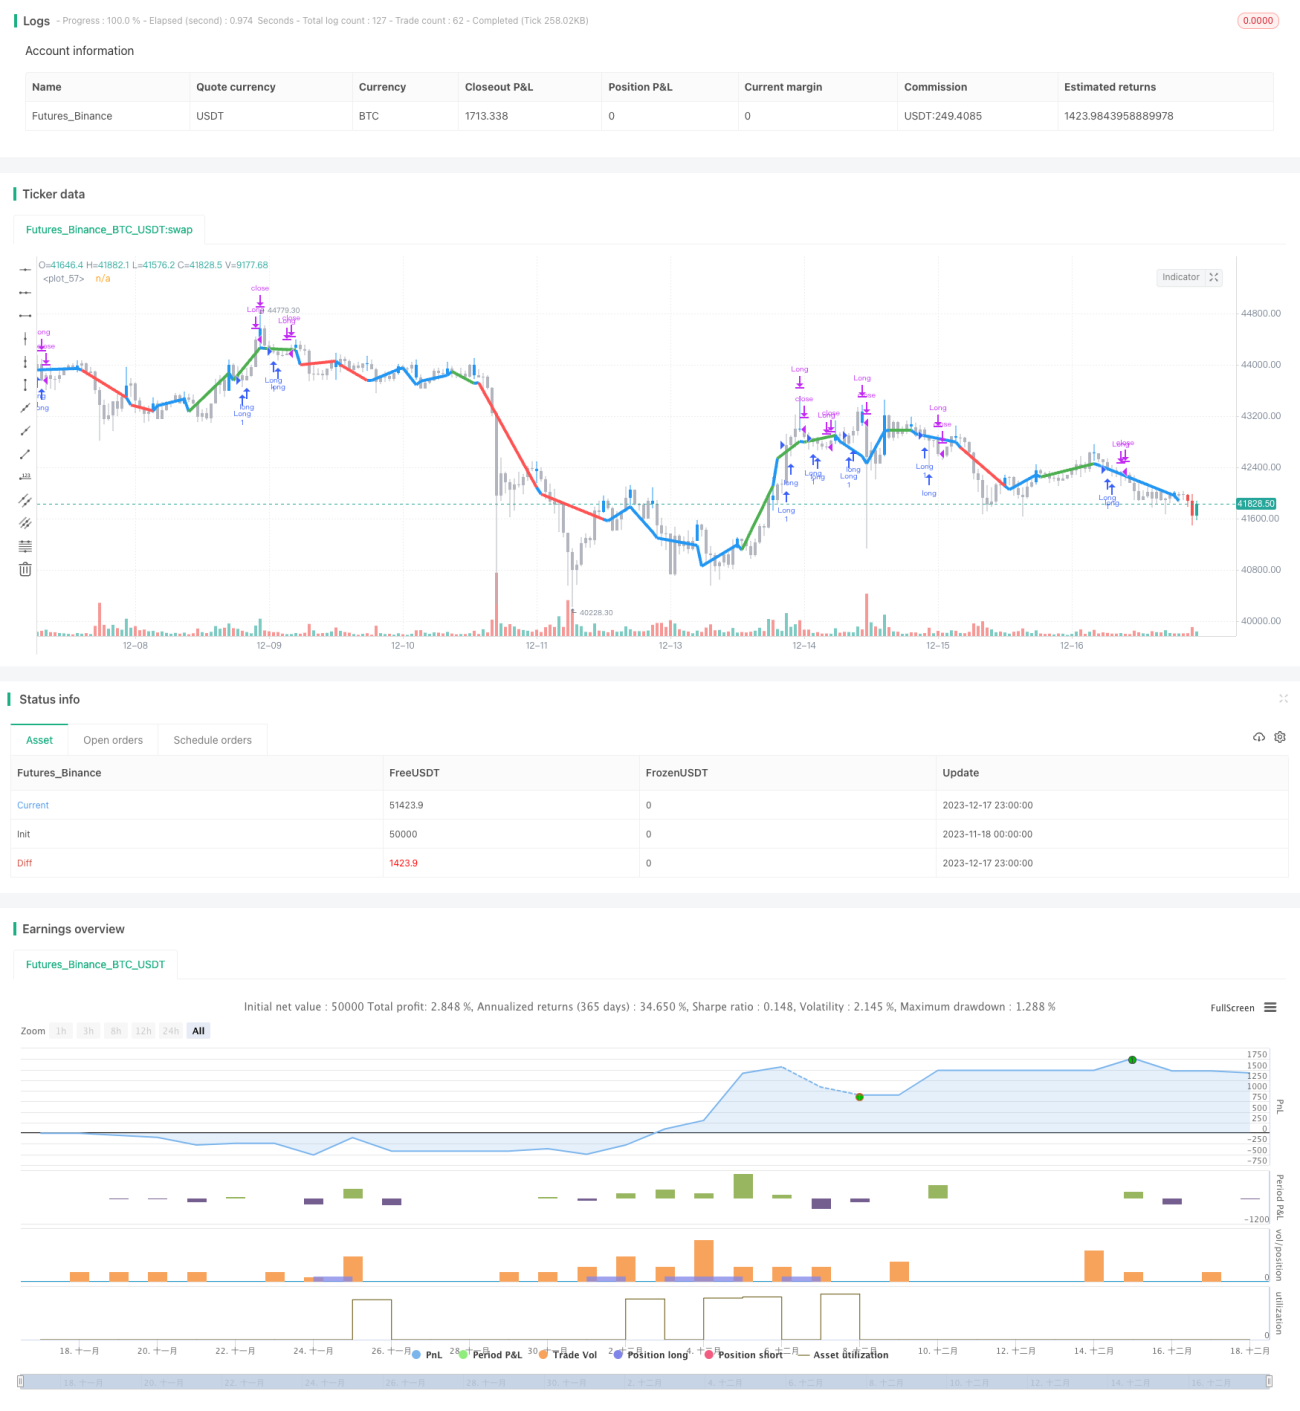
/*backtest
start: 2023-11-18 00:00:00
end: 2023-12-18 00:00:00
period: 1h
basePeriod: 15m
exchanges: [{"eid":"Futures_Binance","currency":"BTC_USDT"}]
*/
//@version=2
strategy("Fractal Breakout Strategy (by ChartArt)", shorttitle="CA_-_Fractal_Breakout_Strat", overlay=true)
// ChartArt's Fractal Breakout Strategy
//
// Version 1.0
// Idea by ChartArt on April 24, 2016.
//
// This long only strategy determines the last fractal top
// and enters a trade when the price breaks above the last
// fractal top. The strategy also calculates the average
// price of the last 2 (or 3) fractal tops to get the trend.
//
// The strategy exits the long trade when the average of the
// fractal tops is falling (when the trend is lower highs).
// And the user can manually set a delay of this exit.
//
// In addition the fractals tops can be colored in blue
// and a line can be drawn based on the fractal tops.
// This fractal top line is colored by the fractal trend.
//
// List of my work:
// https://www.tradingview.com/u/ChartArt/
//
// __ __ ___ __ ___
// / ` |__| /\ |__) | /\ |__) |
// \__, | | /~~\ | \ | /~~\ | \ |
//
//
// input
n_time = input(title='Always exit each trade after this amount of bars later (Most important strategy setting)', defval=3)
price = input(hl2,title='Price type to determine the last fractal top and the fractal breakout, the default is (high+low)/2')
// fractal calculation
fractal_top = high[2] > high[3] and high[2] > high[4] and high[2] > high[1] and high[2] > high[0]
fractal_price = valuewhen(fractal_top, price, 1)
use_longer_average = input(true,title='Use Fractal price average of the last 3 fractals instead of the last 2 fractals?')
fractal_average = use_longer_average?(fractal_price[1] + fractal_price[2] + fractal_price[3] ) / 3 : (fractal_price[1] + fractal_price[2]) / 2
fractal_trend = fractal_average[0] > fractal_average[1]
no_repainting = input(true,title='Use the price of the last bar to prevent repainting?')
fractal_breakout = no_repainting?price[1] > fractal_price[0]:price[0] > fractal_price[0]
// highlight fractal tops
show_highlight = input(true,title='Highlight fractal tops in blue and color all other bars in gray?')
highlight = fractal_top?blue:silver
barcolor(show_highlight?highlight:na,offset=-2)
show_fractal_top_line = input(true,title='Draw a colored line based on the fractal tops?')
fractal_top_line = change(fractal_top) != 0 ? price : na
fractal_top_line_color = change(fractal_price) > 0 and fractal_breakout == true ? green : change(fractal_price) < 0 and fractal_breakout == false ? red : blue
plot(show_fractal_top_line?fractal_top_line:na,offset=-2,color=fractal_top_line_color,linewidth=4)
// strategy
trade_entry = fractal_trend and fractal_breakout
trade_exit = fractal_trend[n_time] and fractal_trend == false
if (trade_entry)
strategy.entry('Long', strategy.long)
if (trade_exit)
strategy.close('Long')