
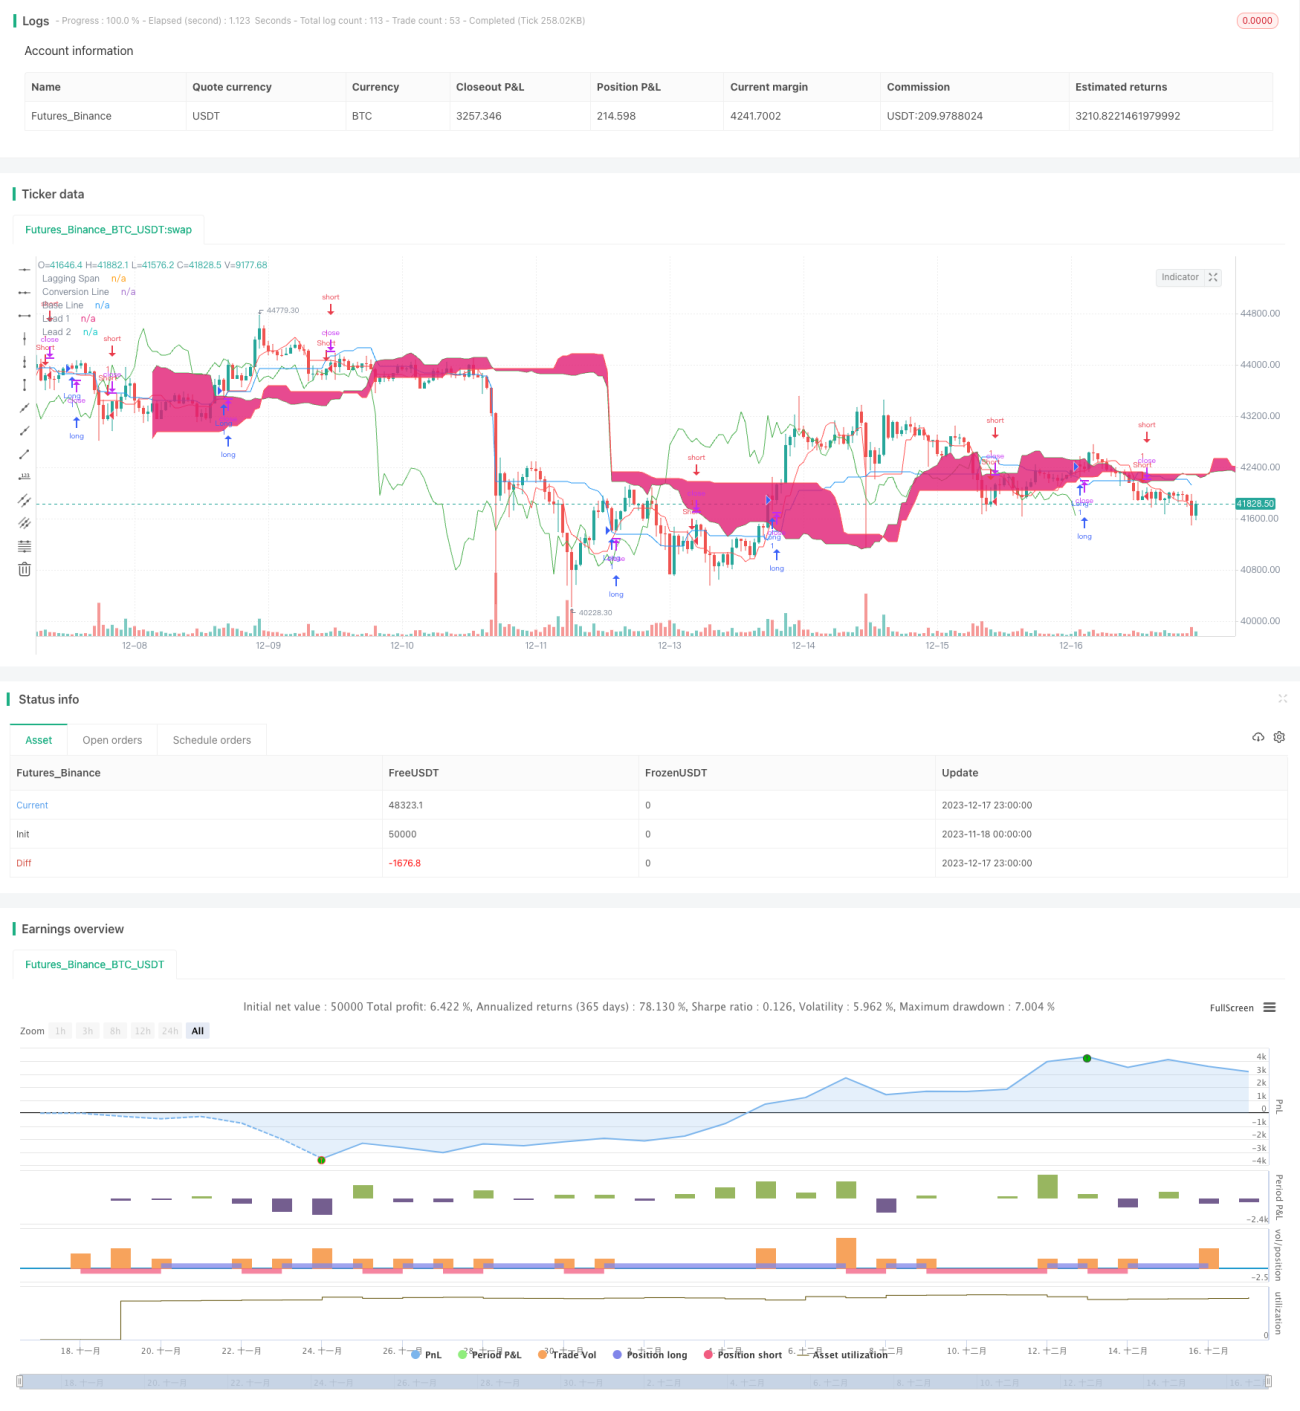
이치모쿠 평평선 교차 전략은 일련의 평평선을 계산하고, 주가 교차 신호를 인식하여, 장거리 또는 다중 하위 거래를 수행한다. 이 전략은 여러 가지 기술 지표를 결합하고, 탄탄하고 신뢰할 수 있으며, 중장거리 거래에 적합하다.
이치모쿠 평행선 교차전략은 5개의 평행선으로 구성된 특수 지표 시스템을 사용합니다. 구체적으로, 교차선, 기준선, 선행 1, 선행 2, 그리고 지연선 5개의 평행선을 포함한다. 이 중, 교차선은 근기 가격동력의 평균선이며, 기준선은 중기 및 장기 가격 경향을 반영하고, 선행선은 교차선과 기준선을 결합하여 미래 흐름을 반영하고, 지연선은 과거 가격을 표시하는 참조를 나타냅니다. 가격이 기준선을 돌파할 때 거래 신호를 생성한다. 이 전략은 동시에 실물선 필터와 K선 색 판단을 결합하여 가짜 돌파를 방지한다.
이치모쿠 평행선 교차 전략은 여러 가지 기술 지표의 장점을 하나로 엮는다. 이치모쿠 평행선 교차 전략은 이동 평균, 가격 채널, 수량 가격 확인과 같은 여러 가지 전략 아이디어를 통합하여 체계적인 방법론 체계를 형성한다. 이것은 거래 신호의 accurateness 및 방향성을 보장한다. 단일 지표 전략에 비해 이 전략은 가짜 신호의 가능성을 크게 줄이고 수익 인자를 향상시킬 수 있다.
이치모쿠 평행선 교차 전략은 트렌드를 따르는 전략으로, 거래 간격이 길다. 이것은 전략이 단기 가격 변동을 포착할 수 없다는 것을 의미한다. 또한, 주가 가격이 급격히 변동할 때 평행선 지표는 무효가 된다. 이러한 경우, 잘못된 신호와 손실 거래가 발생할 수 있다.
이치모쿠 평균선 교차 전략은 다음과 같은 방향으로 최적화 할 수 있습니다: 1) 평균선 매개 변수를 조정하여 다른 주기 및 품종에 맞게 조정합니다. 2) 결합 양 에너지 지표, 가격 및 거래량 관계를 확인합니다.
이치모쿠 평행선 교차 전략은 안정적이고 신뢰할 수 있으며, 핵심 전략으로 적합하며, 다른 알고리즘과 함께 사용된다. 그것은 명확한 트렌드 거래 방향을 제공하며, 파라미터 조정과 다중 지표 최적화는 전략을 더 똑똑하고 유연하게 만든다. 이 전략은 수량 거래자의 주요 연구와 장기적인 적용에 가치가 있다.
/*backtest
start: 2023-11-18 00:00:00
end: 2023-12-18 00:00:00
period: 1h
basePeriod: 15m
exchanges: [{"eid":"Futures_Binance","currency":"BTC_USDT"}]
*/
//Noro
//2018
//@version=3
strategy(title = "Noro's Ichimoku Strategy v1.0", shorttitle = "Ichimoku str 1.0", overlay = true, default_qty_type = strategy.percent_of_equity, default_qty_value = 100, pyramiding = 0)
//Settings
needlong = input(true, defval = true, title = "Long")
needshort = input(true, defval = true, title = "Short")
conversionPeriods = input(9, minval = 1, title = "Conversion Periods")
basePeriods = input(26, minval = 1, title = "Base Periods")
laggingSpan2Periods = input(52, minval = 1, title = "Lagging Span")
usebf = input(true, defval = true, title = "Use body filter")
usecf = input(true, defval = true, title = "Use color filter")
fromyear = input(1900, defval = 1900, minval = 1900, maxval = 2100, title = "From Year")
toyear = input(2100, defval = 2100, minval = 1900, maxval = 2100, title = "To Year")
frommonth = input(01, defval = 01, minval = 01, maxval = 12, title = "From Month")
tomonth = input(12, defval = 12, minval = 01, maxval = 12, title = "To Month")
fromday = input(01, defval = 01, minval = 01, maxval = 31, title = "From day")
today = input(31, defval = 31, minval = 01, maxval = 31, title = "To day")
//Ichimoku
donchian(len) => avg(lowest(len), highest(len))
conversionLine = donchian(conversionPeriods)
baseLine = donchian(basePeriods)
leadLine1 = avg(conversionLine, baseLine)
leadLine2 = donchian(laggingSpan2Periods)
//Lines
plot(conversionLine, color=red, title="Conversion Line")
plot(baseLine, color=blue, title="Base Line")
plot(close, offset = -basePeriods, color=green, title="Lagging Span")
p1 = plot(leadLine1, offset = basePeriods, color=green, title="Lead 1")
p2 = plot(leadLine2, offset = basePeriods, color=red, title="Lead 2")
fill(p1, p2)
//Body Filter
nbody = abs(close - open)
abody = sma(nbody, 10)
body = nbody > abody / 3 or usebf == false
//Color Filter
bar = close > open ? 1 : close < open ? -1 : 0
gb = bar == 1 or usecf == false
rb = bar == -1 or usecf == false
//Signals
up = low > baseLine and rb and body
dn = high < baseLine and gb and body
//Trading
if up
//if strategy.position_size < 0
// strategy.close_all()
strategy.entry("Long", strategy.long, needlong == false ? 0 : na, when=(time > timestamp(fromyear, frommonth, fromday, 00, 00) and time < timestamp(toyear, tomonth, today, 23, 59)))
if dn
//if strategy.position_size > 0
// strategy.close_all()
strategy.entry("Short", strategy.short, needshort == false ? 0 : na, when=(time > timestamp(fromyear, frommonth, fromday, 00, 00) and time < timestamp(toyear, tomonth, today, 23, 59)))
if time > timestamp(toyear, tomonth, today, 23, 59)
strategy.close_all()