개요
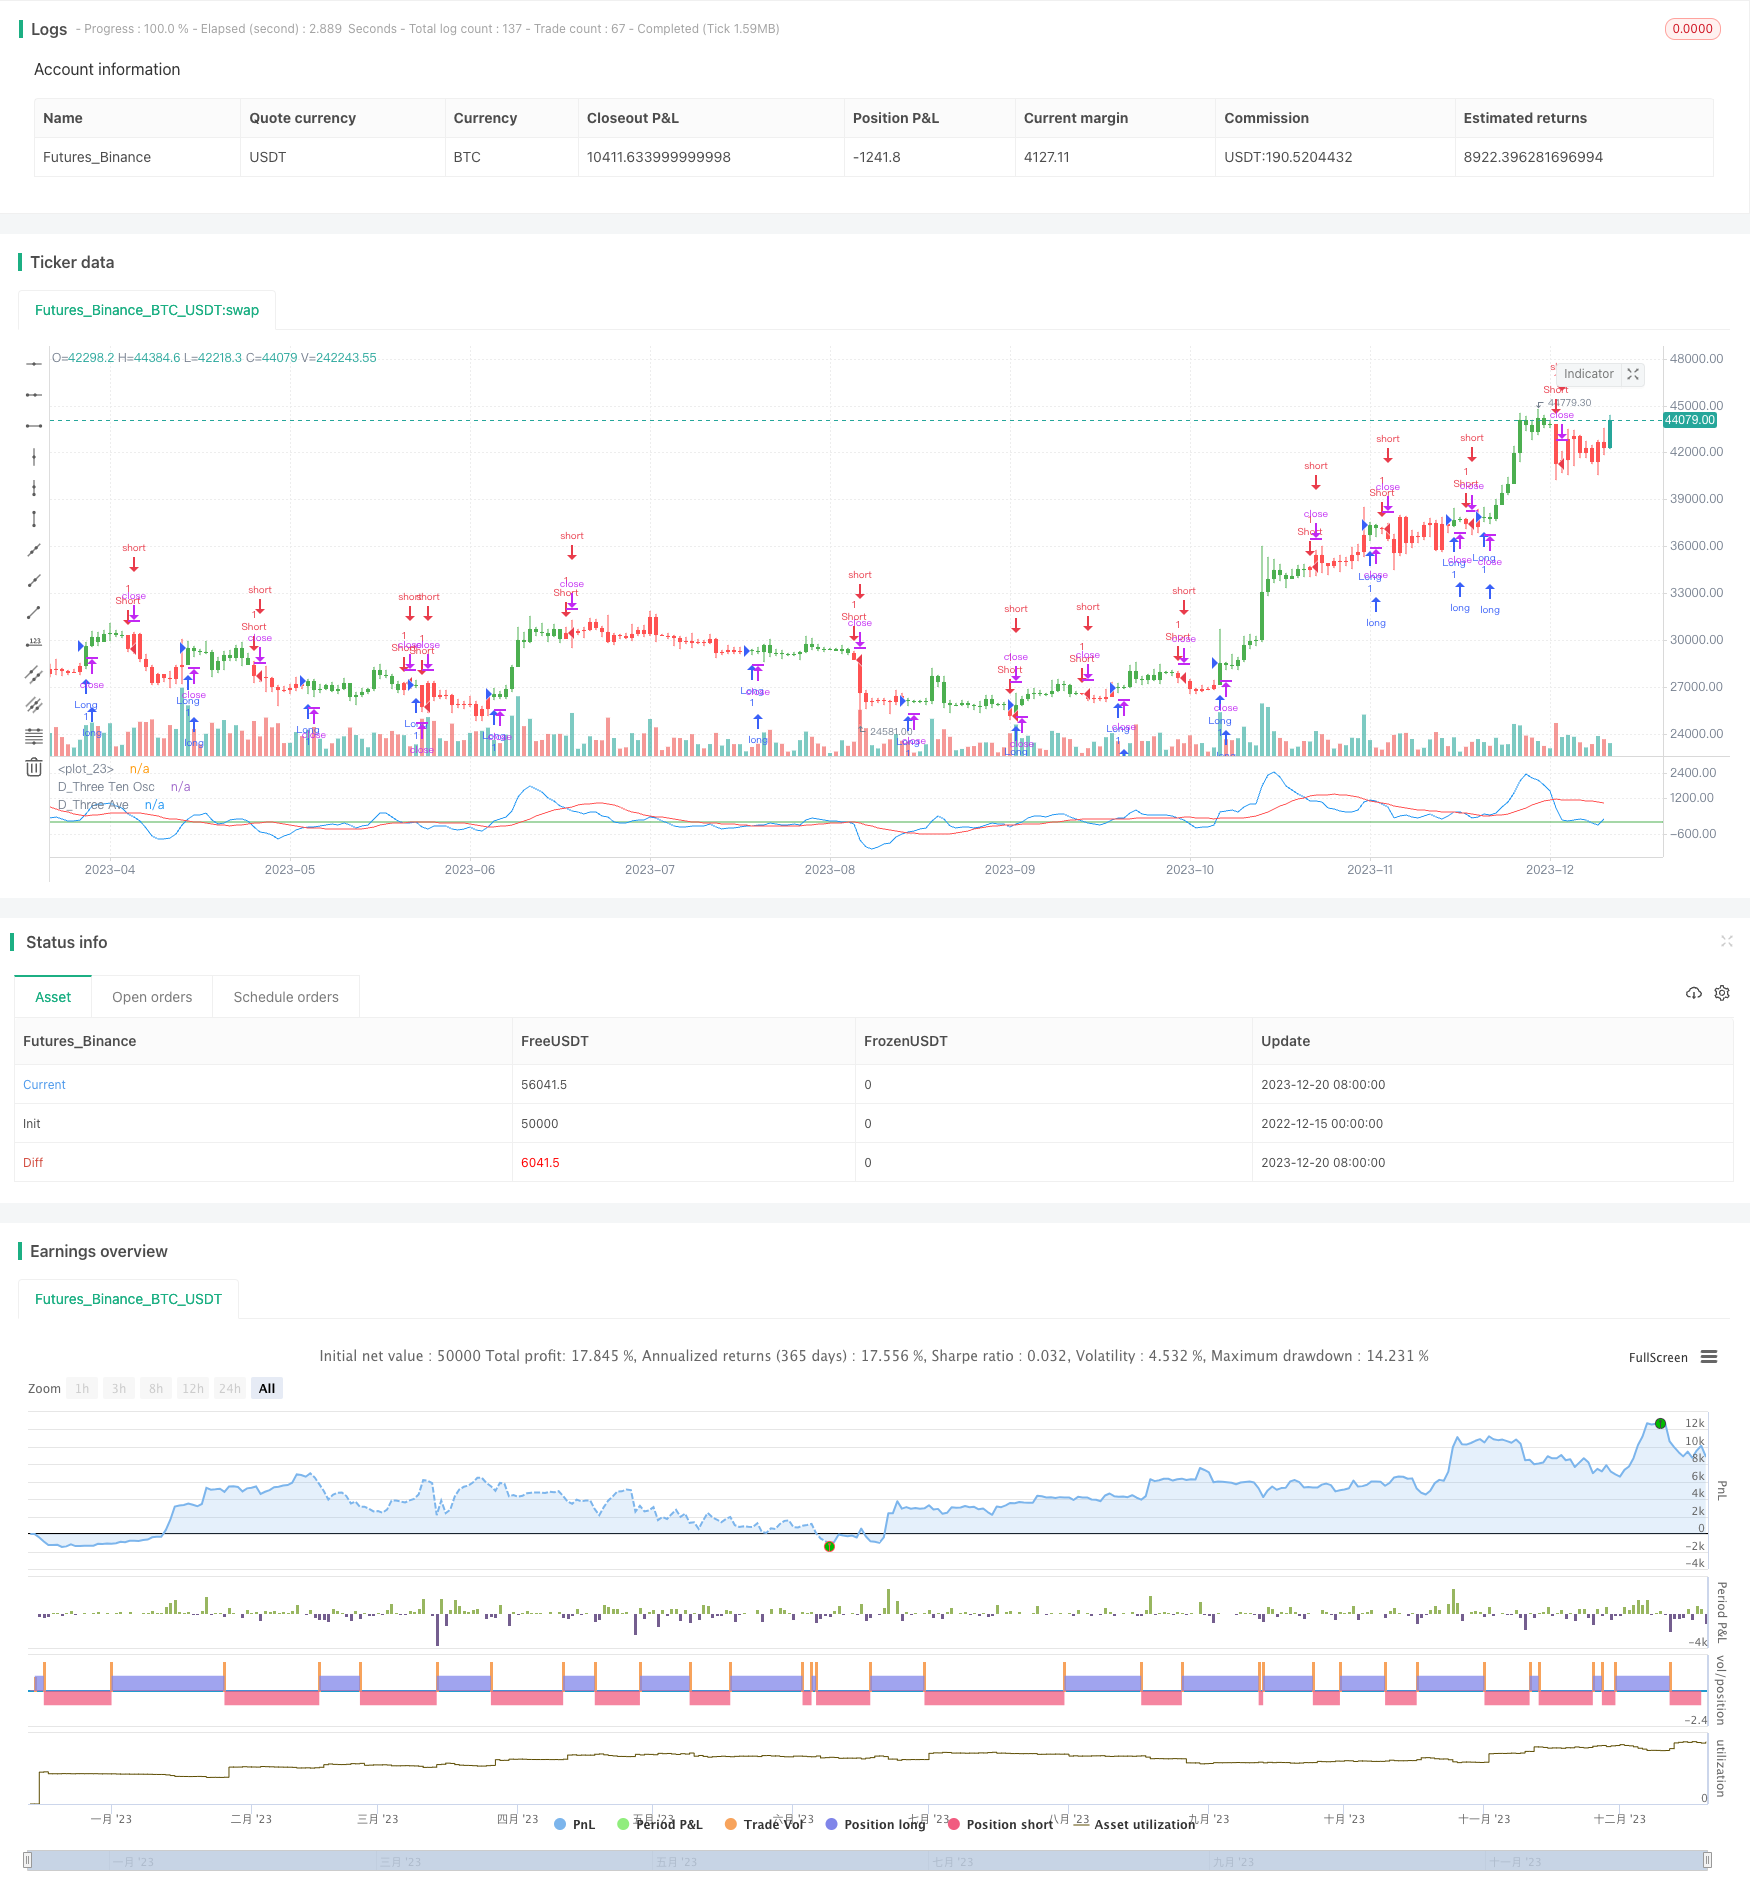
진동 지수 변환 전략 (Oscillator Index Transformation Strategy) 은 브레세르트의 3-10 진동 지수와 16일 간소 이동 평균 사이의 교차를 이용하여 거래 신호를 생성한다. 이 전략은 낮과 밤 사이에 거래한다.
전략 원칙
이 전략은 브레서트의 3-10 변동 지수를 기반으로 하고 있는데, 이 지수는 3일 지수 이동 평균과 10일 지수 이동 평균의 차원이다. 빠른 선 (<3-10 변동 지수>) 에서 긴 선 (<16일 간단한 이동 평균>) 을 통과할 때 더 많이 하고, 빠른 선 아래에서 긴 선을 통과할 때 공허한다.
구체적으로, 전략은 먼저 3일 EMA, 10일 EMA 및 그 차이점을 진동 지수로서 계산한다. 그리고 16일 진동 지수의 간단한 이동 평균을 신호 선으로 계산한다. 진동 지수 상에서 신호 선을 통과할 때 더하고, 아래를 통과할 때 공백을 한다.
우위 분석
- 고전적인 브레세트 진동 지수를 사용해서 효과를 볼 수 있습니다.
- 트랜지션 신호를 형성하기 위해 빠른 및 느린 선의 교차와 결합하여, 입구와 출구를 쉽게 판단할 수 있습니다.
- 시장 환경의 변화에 적응할 수 있는 역동적인 접근을 허용합니다.
- 낮과 야간 거래에서 사용할 수 있습니다.
위험 분석
- 브레세트 진동 지수 효과는 안정적이지 않으며, 수익과 손실의 변동이 있습니다.
- 빠른선과 느린선 교차 신호는 가짜 신호가 발생할 수 있습니다.
- 리버스 방식은 위험하고 신중하게 사용해야 합니다.
- 낮 거래는 손해 방지 전략을 고려해야 하며, 야간 거래는 자금 관리를 고려해야 합니다.
최적화 방향
- 최적화 변수, 이동 평균 주기를 조정, 최적의 변수 조합을 찾아
- 필터링 조건을 추가하여 다른 지표 또는 가격 형태와 함께 신호 품질을 판단합니다.
- 더 많은 손실을 방지하기 위한 전략, 합리적인 손실을 방지하기 위한 전략, 단독 손실을 통제하기 위한 전략
- 자금 관리를 최적화하고, 포지션 크기를 조정하고, 단일 손실이 총 자금에 미치는 영향을 줄입니다.
요약하다
흔들림 지수 변화 전략은 짧은 라인 거래 전략에 속하며, 브레세트의 3-10 흔들림 지수와 그 신호 라인의 교차로 거래 신호를 생성합니다. 간단하고 실용적입니다. 이 전략은 낮과 밤 거래에 적용할 수 있지만, 약간의 손실 변동과 가짜 신호 위험이 있지만, 필터링 조건을 추가하여 손실을 최적화하여 개선해야합니다.
전략 소스 코드
/*backtest
start: 2022-12-15 00:00:00
end: 2023-12-21 00:00:00
period: 1d
basePeriod: 1h
exchanges: [{"eid":"Futures_Binance","currency":"BTC_USDT"}]
*/

//@version=2
////////////////////////////////////////////////////////////
//  Copyright by HPotter v1.0 27/03/2017
// TradeStation does not allow the user to make a Multi Data Chart with
// a Tick Bar Chart and any other type a chart. This indicator allows the
// user to plot a daily 3-10 Oscillator on a Tick Bar Chart or any intraday interval.
// Walter Bressert's 3-10 Oscillator is a detrending oscillator derived
// from subtracting a 10 day moving average from a 3 day moving average.
// The second plot is an 16 day simple moving average of the 3-10 Oscillator.
// The 16 period moving average is the slow line and the 3/10 oscillator is
// the fast line.
// For more information on the 3-10 Oscillator see Walter Bressert's book
// "The Power of Oscillator/Cycle Combinations"
//
// You can change long to short in the Input Settings
// Please, use it only for learning or paper trading. Do not for real trading.
////////////////////////////////////////////////////////////
strategy(title="D_Three Ten Osc", shorttitle="D_Three Ten Osc")
Length1 = input(3, minval=1)
Length2 = input(10, minval=1)
Length3 = input(16, minval=1)
reverse = input(false, title="Trade reverse")
hline(0, color=green, linestyle=line)
xPrice =  request.security(syminfo.tickerid,"D", hl2)
xfastMA = ema(xPrice, Length1)
xslowMA = ema(xPrice, Length2)
xMACD = xfastMA - xslowMA
xSignal = sma(xMACD, Length3)
pos = iff(xSignal > xMACD, -1,
	     iff(xSignal < xMACD, 1, nz(pos[1], 0)))
possig = iff(reverse and pos == 1, -1,
          iff(reverse and pos == -1, 1, pos))
if (possig == 1)
    strategy.entry("Long", strategy.long)
if (possig == -1)
    strategy.entry("Short", strategy.short)
barcolor(possig == -1 ? red: possig == 1 ? green : blue )
plot(request.security(syminfo.tickerid, "D", xMACD), color=blue, title="D_Three Ten Osc")
plot(request.security(syminfo.tickerid, "D", xSignal), color=red, title="D_Three Ave")