개요
이 전략은 다중주기 감정 분석 방법을 사용하여 XBTUSD 계약에 대해 다중 거래한다. 다양한 주기의 가격 변동량과 최고 가격, 최저 가격 정보를 종합적으로 고려하고, 일련의 무게 조정을 통해 현재 시장의 전체적인 감정 가치를 계산한다. 감정 가치의 변화 법칙에 따라 상황을 판단하여 구매 및 판매 신호를 생성한다.
전략 원칙
a에서 j 사이클에 대한 최고 가격, 최저 가격, 평균 가격, 가격 변동량 등의 지표를 계산한다.
가격 범위 내의 표준화된 위치를 정의하고, 각 주기별 가격 변동의 폭을 결합하여, 다른 주기에서의 감정 값을 계산한다.
감정값은 일련의 무게 (w 변수) 를 조정하여 전체적인 감정값 (sentiment) 을 계산한다. 감정값은 현재 시장의 평균적인 감정을 반영한다.
감정값의 변동 상황을 분석하여, 감정이 긍정에서 부정으로 바뀌었을 때, 판매 신호를 생성한다. 감정이 부정에서 긍정으로 바뀌었을 때, 구매 신호를 생성한다.
감정의 절대적인 변동 값의 크기 (델타 변수), 진입의 강도를 판단하고, 정지 손실 조건을 설정한다.
전략적 이점
다양한 시기의 여러 가지 감정을 고려하여 시장의 흐름을 더 포괄적으로 판단합니다.
중량 조정 메커니즘은 전략을 안정화시킵니다.
감정적 가치와 감정적 변동성을 종합적으로 고려하여 입학 시점을 더 정확하게 판단할 수 있다.
최고 가격과 최저 가격, 스톱 스톱 손실 메커니즘 제어 위험.
전략적 위험
잘못된 매개 변수 설정으로 인해 거래가 너무 빈번하거나 거래 기회를 놓치게 될 수 있습니다.
갑자기 일어난 검은 천둥 사건으로 인해 전략이 실패할 수 있습니다.
계약 조정, 거래 규칙 변경 등이 전략에 영향을 미칠 수 있다.
감정값 계산은 역사적 데이터에 의존하며 시장 구조가 변화할 때 재평가 및 조정할 필요가 있다.
무게, 거래 주기, 스톱 스톱 손실 범위 등의 파라미터를 조정하여 최적화 할 수 있으며, 전략이 시장 구조의 변화에 더 잘 적응 할 수 있습니다. 동시에 자금 관리를 최적화하고, 단일 거래 규모와 전체 포지션을 엄격하게 제어합니다.
최적화 방향
감정적 판단의 기초를 풍요롭게 하는 분석 주기들을 계속 확장하라.
감정 판단과 기술 지표의 조합을 위한 기술 지표를 더 추가합니다.
감정적 특징을 추출하기 위한 기계학습 방법.
역동적으로 무게를 조정한다.
스탠프 스탠프 손실 전략을 최적화하기
요약하다
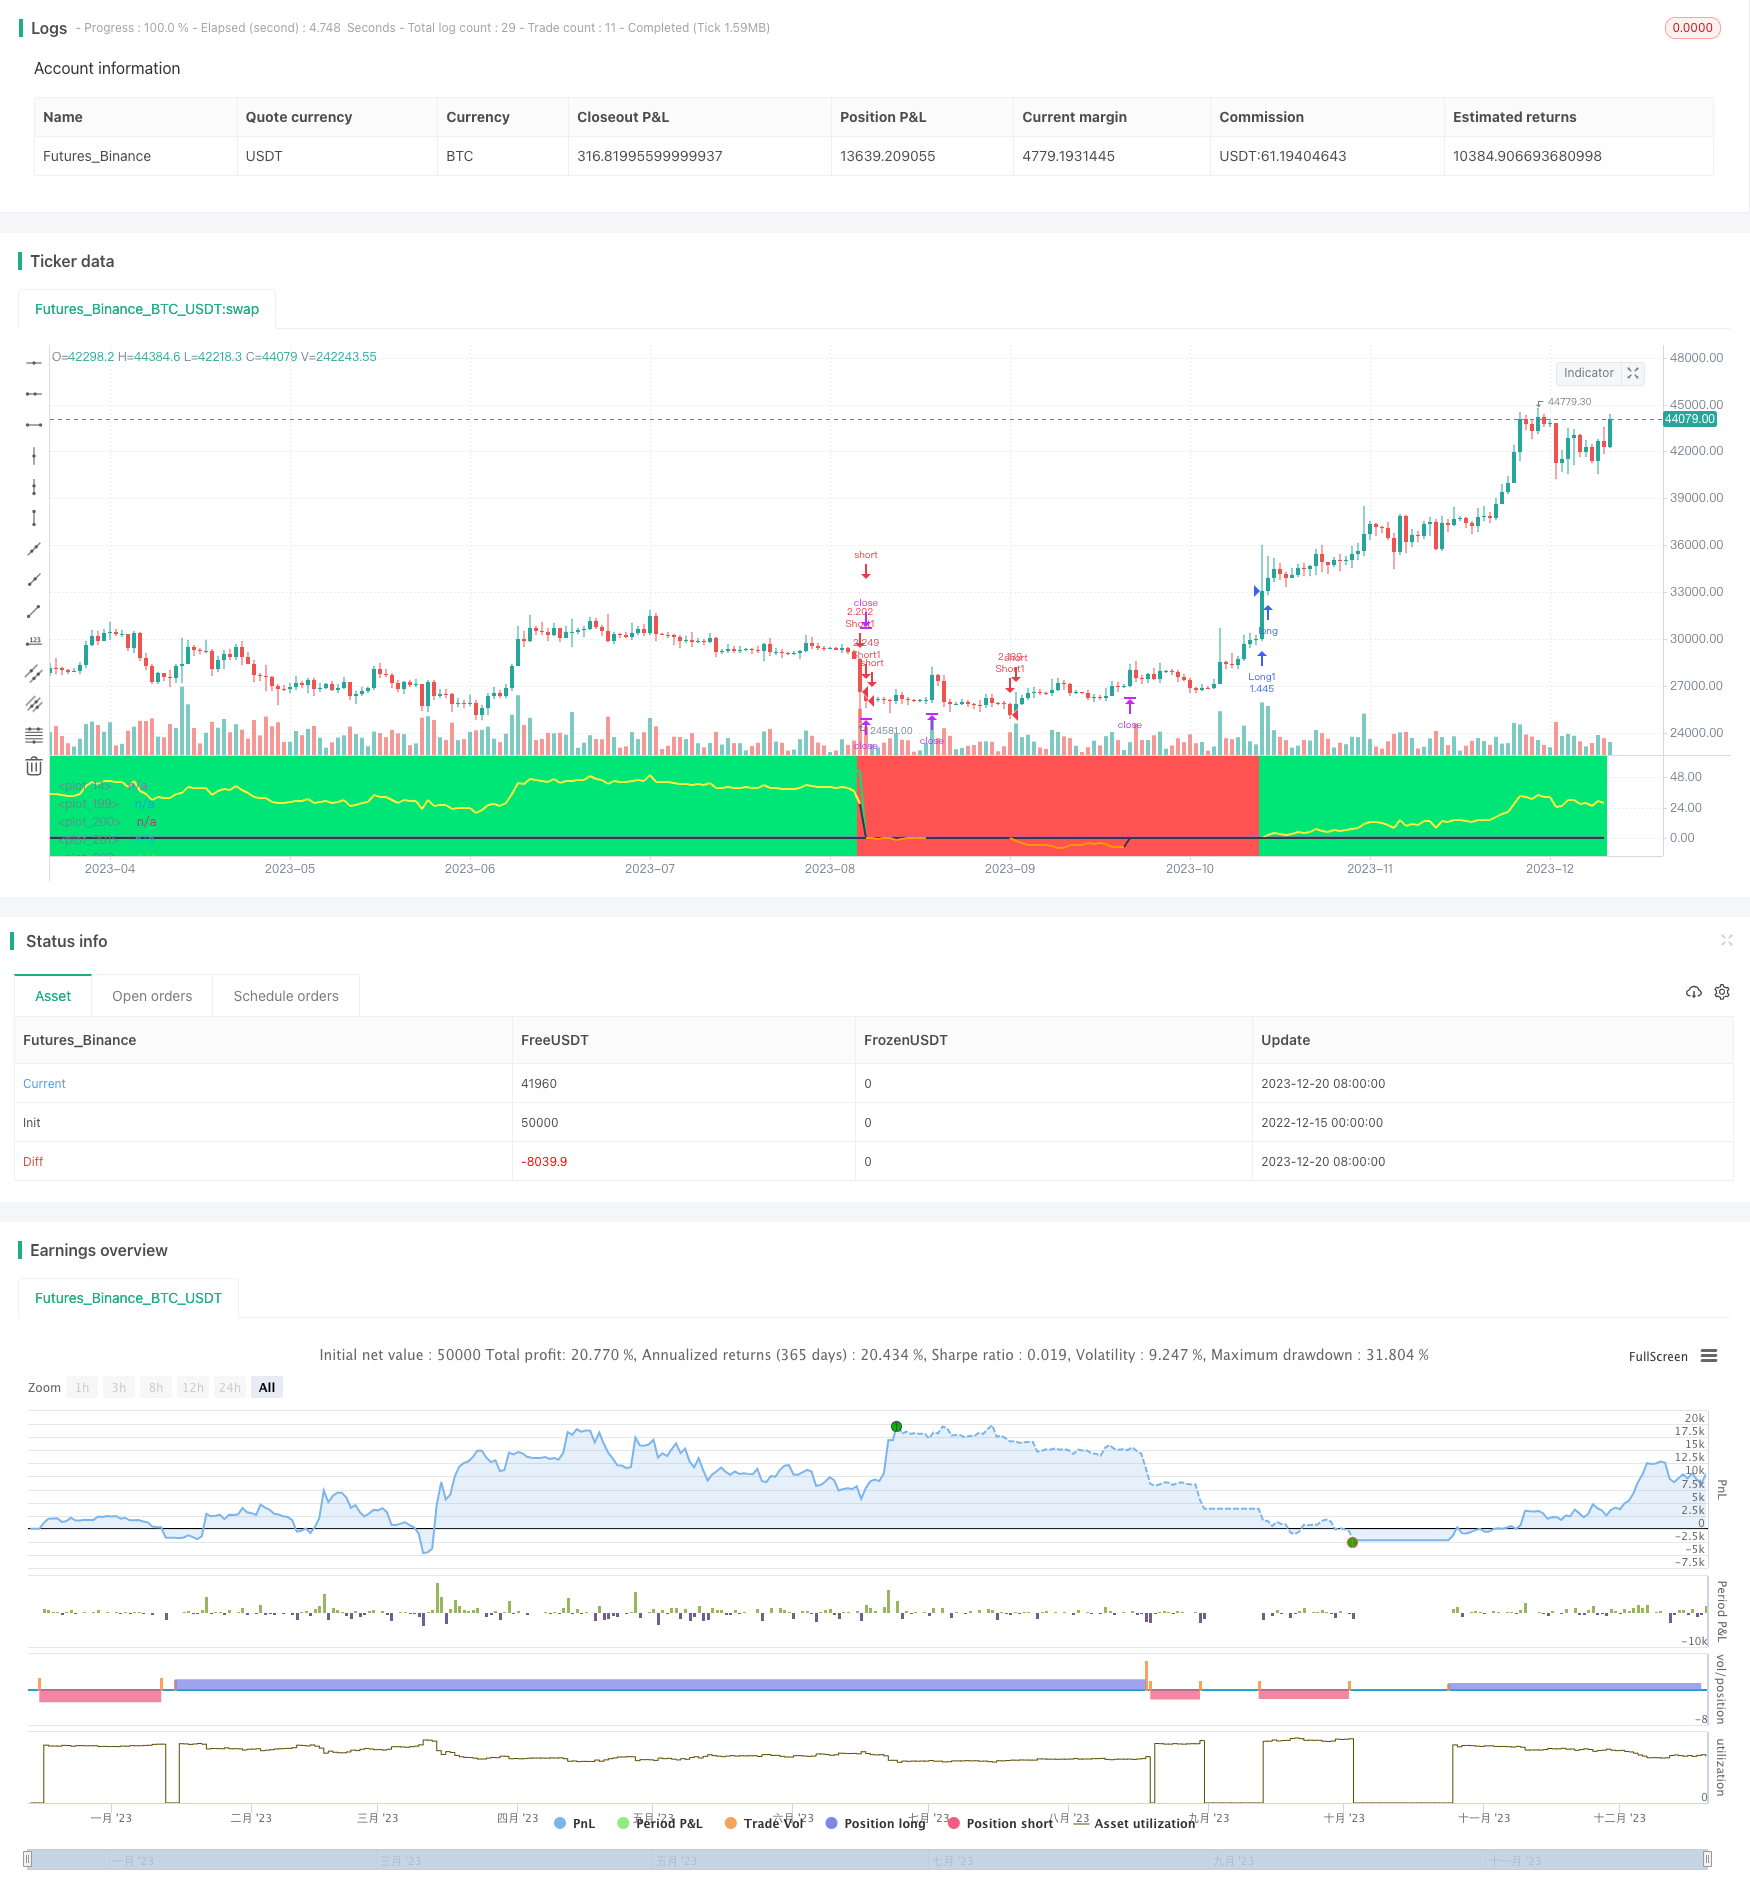
이 전략은 감정 분석의 거래 철학에 기초하여, 다주기 통합 고려를 통해 현재 전체 시장 정서를 판단한다. 그것의 연속적인 감정 변화는 거래 신호를 생성하는 근거로, 가격 변동 정보를 보조하여 특정 진입 시기를 판단한다. 이 전략은 상황을 판단하는 관점의 독특한, 큰 주기적인 흔들림 상황에서 좋은 성능을 발휘한다.
/*backtest
start: 2022-12-15 00:00:00
end: 2023-12-21 00:00:00
period: 1d
basePeriod: 1h
exchanges: [{"eid":"Futures_Binance","currency":"BTC_USDT"}]
*/

// This source code is subject to the terms of the Mozilla Public License 2.0 at https://mozilla.org/MPL/2.0/
// © Jomy

//@version=4

//2h chart BITMEX:XBTUSD
//use on low leverage 1-2x only

strategy("expected range STRATEGY",overlay=false,initial_capital=1000,precision=2)
leverage=input(1,"leverage",step=.5)
tp=input(53,"take profit %",step=1)
sl=input(7,"stoploss %",step=1)
stoploss=1-(sl/100)
plot(stoploss)
level=input(.70,"level to initiate trade",step=.02)
closelevel=input(0.0,"level to close trade",step=.02)
levelshort=input(.68,"level to initiate trade",step=.02)
closelevelshort=input(0.0,"level to close trade",step=.02)

wa=input(1.158,"weight a",step=.2)
wb=input(1.119,"weight b",step=.2)
wc=input(1.153,"weight c",step=.2)
wd=input(1.272,"weight d",step=.2)
we=input(1.295,"weight e",step=.2)
wf=input(1.523,"weight f",step=.2)
wg=input(1.588,"weight g",step=.2)
wh=input(2.100,"weight h",step=.2)
wi=input(1.816,"weight i",step=.2)
wj=input(2.832,"weight j",step=.2)
a=1
b=2
c=3
d=5
e=8
f=13
g=21
h=34
i=55
j=89

n=0
n:=if volume > -1
    nz(n[1])+1


ra=highest(high,a)-lowest(low,a)
aa=sma(ohlc4,a)
ha=aa[1]+ra[1]/2
la=aa[1]-ra[1]/2

rb=highest(high,b)-lowest(low,b)
ab=sma(ohlc4,b)
hb=ab[1]+rb[1]/2
lb=ab[1]-rb[1]/2

rc=highest(high,c)-lowest(low,c)
ac=sma(ohlc4,c)
hc=ac[1]+rc[1]/2
lc=ac[1]-rc[1]/2

rd=highest(high,d)-lowest(low,d)
ad=sma(ohlc4,d)
hd=ad[1]+rd[1]/2
ld=ad[1]-rd[1]/2

re=highest(high,e)-lowest(low,e)
ae=sma(ohlc4,e)
he=ae[1]+re[1]/2
le=ae[1]-re[1]/2

rf=highest(high,f)-lowest(low,f)
af=sma(ohlc4,f)
hf=af[1]+rf[1]/2
lf=af[1]-rf[1]/2

rg=highest(high,g)-lowest(low,g)
ag=sma(ohlc4,g)
hg=ag[1]+rg[1]/2
lg=ag[1]-rg[1]/2

rh=highest(high,h)-lowest(low,h)
ah=sma(ohlc4,h)
hh=ah[1]+rh[1]/2
lh=ah[1]-rh[1]/2

ri=highest(high,i)-lowest(low,i)
ai=sma(ohlc4,i)
hi=ai[1]+ri[1]/2
li=ai[1]-ri[1]/2

rj=highest(high,j)-lowest(low,j)
aj=sma(ohlc4,j)
hj=aj[1]+rj[1]/2
lj=aj[1]-rj[1]/2

placea=((close-la)/(ha-la)-.5)*-100
placeb=((close-lb)/(hb-lb)-.5)*-100
placec=((close-lc)/(hc-lc)-.5)*-100
placed=((close-ld)/(hd-ld)-.5)*-100
placee=((close-le)/(he-le)-.5)*-100
placef=((close-lf)/(hf-lf)-.5)*-100
placeg=((close-lg)/(hg-lg)-.5)*-100
placeh=((close-lh)/(hh-lh)-.5)*-100
placei=((close-li)/(hi-li)-.5)*-100
placej=((close-lj)/(hj-lj)-.5)*-100

sentiment=((placea/j)*ra*wa+(placeb/i)*rb*wb+(placec/h)*rc*wc+(placed/g)*rd*wd+(placee/f)*re*we+(placef/e)*rf*wf+(placeg/d)*rg*wg+(placeh/c)*rh*wh+(placei/b)*ri*wi+(placej/a)*rj*wj)/(wa+wb+wc+wd+we+wf+wg+wh+wi+wj)

deltalong=0.0
deltalong:=if sentiment>0
    nz(deltalong[1])+sentiment-sentiment[1]
else
    0
deltashort=0.0
deltashort:=if sentiment<0
    nz(deltashort[1])+((sentiment-sentiment[1])*-1)
else
    0

//plot(sentiment*-1,color=color.blue)
//plot(deltalong,color=color.red)
//plot(deltashort,color=color.lime)

peakfindlong=highest(deltalong,j)*level


peakfindshort=highest(deltashort,j)*levelshort


contracts=(strategy.equity/close)*leverage


//reason for o is this strategy makes dumb trades before the sentiment line crosses the 0 point the first time
o=0
o:=if cross(0,sentiment) and n>j
    1
else
    nz(o[1])

long=deltashort>peakfindlong and o==1

short=deltalong>peakfindshort and o==1


longstart=0.0
longstart:=if strategy.position_size>0 and strategy.position_size[1]<=0
    close
else
    nz(longstart[1])

shortstart=0.0
shortstart:=if strategy.position_size<0 and strategy.position_size[1]>=0
    close
else
    nz(shortstart[1])

highsincelong = 0.0
highsincelong := if strategy.position_size>0
    max(max(highsincelong[1],high),high[1])
else
    0

lowsinceshort = 1000000.0
lowsinceshort := if strategy.position_size<0
    min(min(lowsinceshort[1],low),low[1])
else
    10000000

closelong=strategy.position_size > 0 and ((highsincelong/longstart-1)*100) > tp
closeshort=strategy.position_size < 0 and ((shortstart/lowsinceshort-1)*100) > tp

stoptrade=0
stoptrade:= if closelong
    1
else
    nz(stoptrade[1])

stoptrade:= if short and stoptrade[1]==1
    0
else
    stoptrade

stoptrade:= if closeshort
    -1
else
    stoptrade

stoptrade:= if long and stoptrade[1]==-1
    0
else
    stoptrade

if(closelong)
    strategy.close("Long1")

pnllong = ((close - strategy.position_avg_price) / strategy.position_avg_price)*100
pnlshort = ((strategy.position_avg_price-close) / strategy.position_avg_price) *100
plot (strategy.position_size > 0 ?(highsincelong/longstart-1)*100 : 0.0,color=color.lime,linewidth=2)
plot (strategy.position_size < 0 ?(shortstart/lowsinceshort-1)*100 : 0.0,color=color.red,linewidth=2)
plot( strategy.position_size > 0 ? pnllong:0, color=strategy.position_size > 0 ?color.yellow:color.black,linewidth=2 )
plot( strategy.position_size < 0 ? pnlshort:0, color=strategy.position_size < 0 ?color.orange:color.black,linewidth=2)
longuntilshort=0
longuntilshort:=if long
    1
else
    if short
        -1
    else
        nz(longuntilshort[1])
bgcolor(stoptrade!=0?color.black:longuntilshort==1?color.lime:longuntilshort==-1?color.red:na,transp=70)

if(long and stoptrade==0)
    strategy.entry("Long1",strategy.long,qty=max(1,min(contracts,1000000000)))

if(closelong)
    strategy.close("Long1")

strategy.exit("Long1",stop=longstart * stoploss,when = strategy.position_size>0)

if(short and stoptrade==0)
    strategy.entry("Short1",strategy.short,max(1,min(contracts,1000000000)))

if(closeshort)
    strategy.close("Short1")

strategy.exit("Long1",stop=shortstart / stoploss,when = strategy.position_size<0)