개요
이 전략은 이동 평균의 골든 크로스 원칙에 기초하여 설계되었다. 구체적으로, 그것은 두 개의 다른 주기의 간단한 이동 평균, 즉 50 주기선과 200 주기선 을 사용한다. 50 주기선 아래에서 200 주기선 을 돌파 할 때, 구매 신호를 생성; 50 주기선 위에서 200 주기선 아래로 떨어지면, 판매 신호를 생성한다.
전략 원칙
이 전략은 파인 스크립트 언어로 작성되었으며, 주요 논리는 다음과 같습니다.
- 두 개의 SMA를 계산합니다: 50주기 SMA와 200주기 SMA
- 골드 크로스 판단: 50주기 SMA에 200주기 SMA를 입었을 때, 더 많이 한다
- 죽음의 교차판정: 50주기 SMA 아래에서 200주기 SMA를 통과할 때 평점
여기서 SMA 지표의 중요성은, 그것이 시장상태 데이터의 잡음을 효과적으로 제거하고, Capture 장기적인 트렌드를 다는 것입니다. 빠른 SMA 라인이 느린 SMA 라인을 뚫고, 단기간에 상승한 동력이 장기적인 하향 트렌드를 꺾고, 구매 신호를 생성한다는 것입니다.
전략적 이점
이 전략에는 다음과 같은 장점이 있습니다.
- 이 원칙은 이해하기 쉽고, 실행하기 쉽다.
- PARAMETERS 설정은 합리적이며, 두 개의 SMA 주기를 사용자 정의 할 수 있으며, 다른 시장에 적합합니다.
- 안정된 버전의 파이어 언어로 작성되어 효율적으로 작동한다.
- 시각적 설정은 정보 풍부하고 사용하기 쉽습니다.
위험과 해결
이 전략에는 몇 가지 위험도 있습니다.
가짜 돌파구가 발생할 수 있어 전략이 잘못된 신호를 낸다. 두 SMA 파라미터를 적절히 조정하여 가짜 돌파구가 발생할 확률을 줄일 수 있다.
단기 시장에 대응할 수 없으며, 장기 투자자에게만 적합하다. 빠른 SMA의 주기를 적절히 줄일 수 있다.
철수할 가능성이 크다. 스톱로스를 설정하거나, 적절한 위치 관리를 조정할 수 있다.
더 나은 생각
이 전략은 다음과 같은 차원에서 계속 최적화될 수 있습니다.
다른 지표 필터를 추가하여 여러 구매/판매 조건을 조합하여 가짜 신호의 가능성을 낮출 수 있습니다.
추가된 손해 방지 장치. 가격이 특정 수준으로 떨어지면 강제적인 손해 방지 장치.
포지션 관리를 최적화한다. 예를 들어, 트렌드와 함께 포지션을 높이고, 스톱로스를 추적한다. 철회 통제하고 더 높은 수익을 추구한다.
매개 변수 최적화. 수익 위험 비율에 대한 다양한 매개 변수의 영향을 평가한다.
요약하다
이 전략은 전반적으로 전형적인 트렌드 추적 전략이다. SMA의 장점을 활용하여 간단하고 효율적으로 긴 선의 트렌드를 캡처한다. 자신의 스타일과 매개 변수에 따라 조정할 수 있는 공간을 사용자 정의 할 수 있다. 또한 일부 기존의 결점을 주목하고 추가적인 최적화 및 개선을 수행해야 한다.
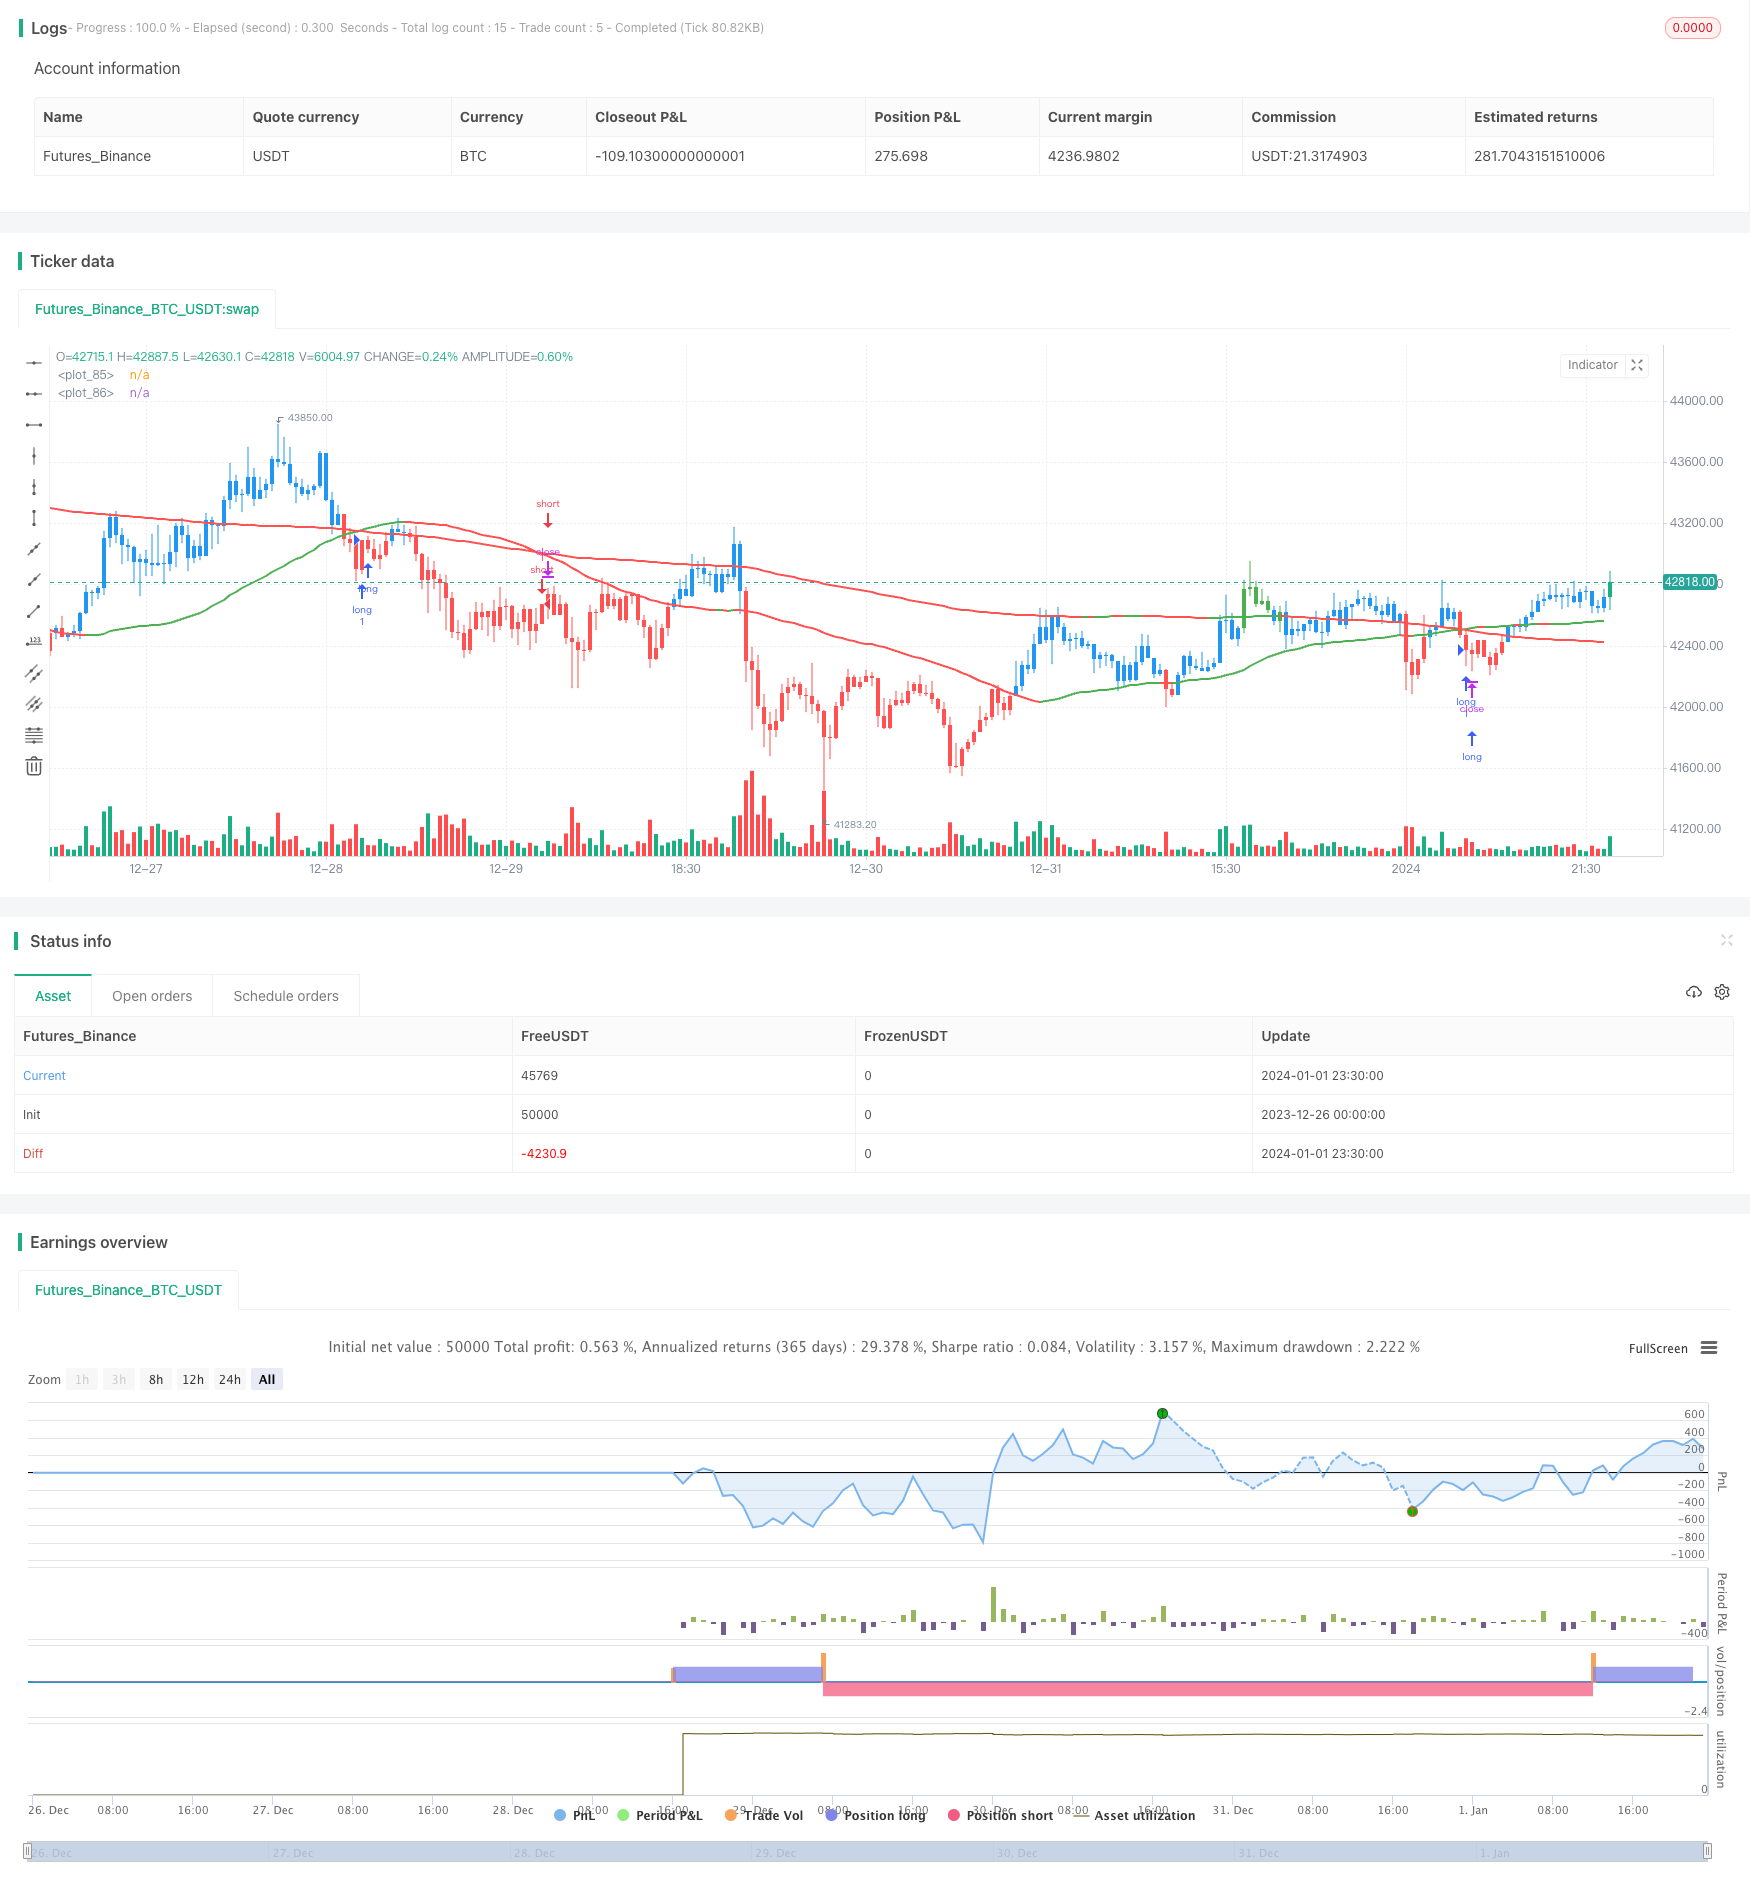
/*backtest
start: 2023-12-26 00:00:00
end: 2024-01-02 00:00:00
period: 30m
basePeriod: 15m
exchanges: [{"eid":"Futures_Binance","currency":"BTC_USDT"}]
*/

// @version=4
//
// This source code is subject to the terms of the Mozilla Public License 2.0 at https://mozilla.org/MPL/2.0/
// www.tradingview.com/u/TradeFab/
// www.tradefab.com
// ___  __        __   __  __       __
//  |  |__)  /\  |  \ |__ |__  /\  |__)
//  |  |  \ /~~\ |__/ |__ |   /~~\ |__)
//
// DISCLAIMER: Futures, stocks and options trading involves substantial risk of loss
// and is not suitable for every investor. You are responsible for all the risks and
// financial resources you use and for the chosen trading system.
// Past performance is not indicative for future results. In making an investment decision,
// traders must rely on their own examination of the entity making the trading decisions!
//
// TradeFab's Golden Cross Strategy.
// The strategy goes long when the faster SMA 50 (the simple moving average of the last 50 bars) crosses
// above the SMA 200. Orders are closed when the SMA 50 crosses below SMA 200. The strategy does not short.
//
VERSION = "1.2"
// 1.2 FB 2020-02-09 converted to Pine version 4
// 1.1 FB 2017-01-15 added short trading
// 1.0 FB 2017-01-13 basic version using SMAs
//
strategy(
   title        = "TFs Golden Cross " + VERSION,
   shorttitle   = "TFs Golden Cross " + VERSION,
   overlay      = true
   )


///////////////////////////////////////////////////////////
// === INPUTS ===
///////////////////////////////////////////////////////////
inFastSmaPeriod     = input(title="Fast SMA Period", type=input.integer, defval=50, minval=1)
inSlowSmaPeriod     = input(title="Slow SMA Period", type=input.integer, defval=200, minval=1)

// backtest period
testStartYear       = input(title="Backtest Start Year",    type=input.integer, defval=2019, minval=2000)
testStartMonth      = input(title="Backtest Start Month",   type=input.integer, defval=1, minval=1, maxval=12)
testStartDay        = input(title="Backtest Start Day",     type=input.integer, defval=1, minval=1, maxval=31)
testStopYear        = input(title="Backtest Stop Year",     type=input.integer, defval=2099, minval=2000)
testStopMonth       = input(title="Backtest Stop Month",    type=input.integer, defval=12, minval=1, maxval=12)
testStopDay         = input(title="Backtest Stop Day",      type=input.integer, defval=31, minval=1, maxval=31)


///////////////////////////////////////////////////////////
// === LOGIC ===
///////////////////////////////////////////////////////////
smaFast = sma(close, inFastSmaPeriod)
smaSlow = sma(close, inSlowSmaPeriod)

bullishCross = crossover (smaFast, smaSlow)
bearishCross = crossunder(smaFast, smaSlow)

// detect valid backtest period
isTestPeriod() => true


///////////////////////////////////////////////////////////
// === POSITION EXECUTION ===
///////////////////////////////////////////////////////////
strategy.entry("long",  strategy.long,  when=bullishCross)
strategy.entry("short", strategy.short, when=bearishCross)


///////////////////////////////////////////////////////////
// === PLOTTING ===
///////////////////////////////////////////////////////////
// background color
nopColor = color.new(color.gray, 50)
bgcolor(not isTestPeriod() ? nopColor : na)

bartrendcolor =
   close > smaFast and
   close > smaSlow and
   change(smaSlow) > 0
       ? color.green
       : close < smaFast and
         close < smaSlow and
         change(smaSlow) < 0
             ? color.red
             : color.blue
barcolor(bartrendcolor)
plot(smaFast, color=change(smaFast) > 0 ? color.green : color.red, linewidth=2)
plot(smaSlow, color=change(smaSlow) > 0 ? color.green : color.red, linewidth=2)

// label
posColor = color.new(color.green, 75)
negColor = color.new(color.red, 75)
dftColor = color.new(color.blue, 75)
posProfit= (strategy.position_size != 0) ? (close * 100 / strategy.position_avg_price - 100) : 0.0
posDir   = (strategy.position_size  > 0) ? "long" : strategy.position_size < 0 ? "short" : "flat"
posCol   = (posProfit > 0) ? posColor : (posProfit < 0) ? negColor : dftColor

var label lb = na
label.delete(lb)
lb := label.new(bar_index, max(high, highest(5)[1]),
   color=posCol,
   text="Pos: "+ posDir +
      "\nPnL: "+tostring(posProfit, "#.##")+"%" +
      "\nClose: "+tostring(close, "#.##"))