개요
이 전략은 역사적인 변동률에 기반한 필터를 추가하여 개선된 버전의 구매 및 보유 전략을 구현합니다. 필터의 역할은 시장의 변동성이 높은 기간 동안 구매 입장을 닫고, 변동성이 낮은 시간에 구매 입장을 재설립하여 전략의 최대 인출을 감소시킵니다.
전략 원칙
- 지난 100일 동안 SPY의 역사적인 변동률을 계산합니다.
- 만약 현재 변동률이 지난 100일 변동률의 95분의 1보다 높다면, 그 거래일을 필터링하여 입찰을 종료합니다.
- 만약 변동률이 95점점 이하인 경우, 구매 포지션을 설정합니다.
우위 분석
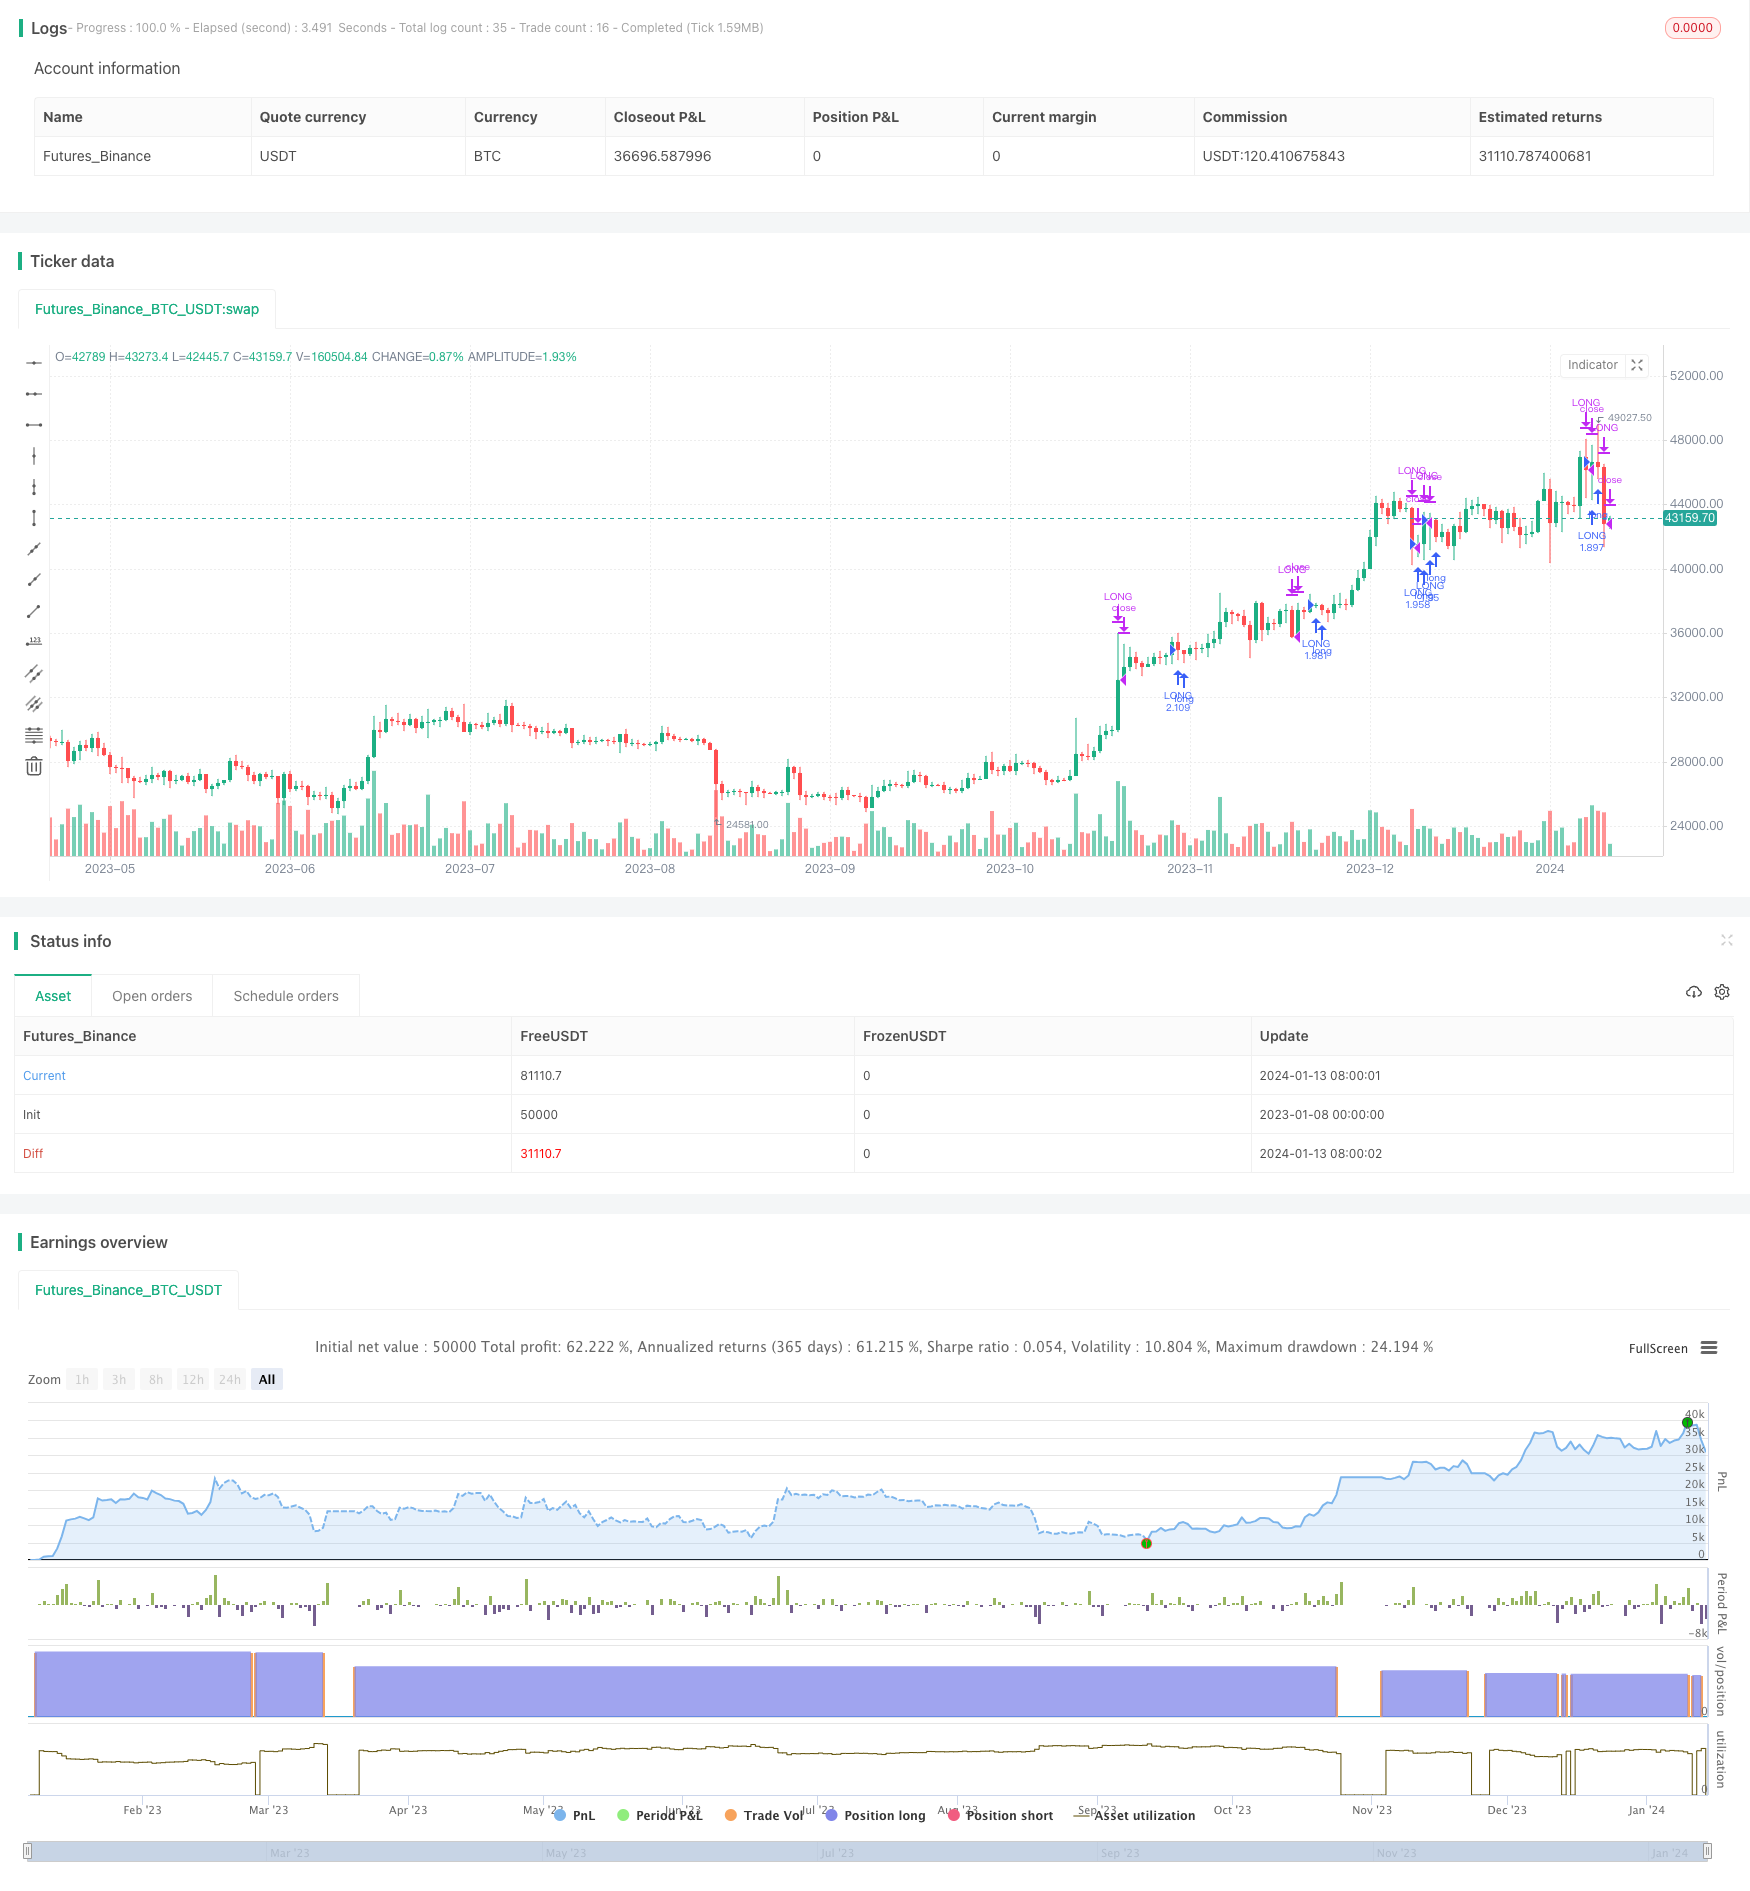
필터 없는 간단한 구매 및 보유 전략에 비해, 이 전략은 28 년의 재검토 기간 동안 연간 수익률이 증가했다 (7.95% vs 9.92%), 최대 회수율이 크게 감소했다 (50.79% vs 31.57%). 이것은 시장의 변동성 필터를 추가하면 전략 수익률이 어느 정도 향상되고 위험을 줄일 수 있음을 보여줍니다.
위험 분석
이 전략의 주요 위험은 변동률 계산 방법과 필터 변수 설정의 정확성에 있습니다. 변동률 계산이 정확하지 않으면 필터는 작동하지 않습니다. 필터 변수 설정이 너무 보수적이거나 너무 급진적이면 전략 수익에 부정적인 영향을 미칩니다. 또한, Past performance is not indicative of future results, 전략의 역사적인 성과는 미래의 성과를 나타내지 않습니다.
최적화 방향
다른 필터 표시기를 확인 신호로 추가하는 것을 고려할 수 있습니다. 예를 들어, 장기 이동 평균, 대장 지수 ADX 지표 등이 있습니다. 다른 파라미터 조정 최적화도 중요합니다. 예를 들어, 다른 룩백 기간, 필터링 임계 등을 테스트하는 파라미터 설정도 있습니다. 기계 학습 및 시간 순서 분석 기술은 변동률 예측 모델을 구축하고 최적화 할 수 있습니다.
요약하다
이 전략은 간단한 역사적인 변동율 기반 필터를 통해 SPY 구매 보유 전략의 수익률을 크게 향상시켰으며 최대 인출을 크게 줄였습니다. 이것은 시장 상태의 식별과 자산 배열의 중요성을 증명합니다. 우리는 변동율 모델을 계속 최적화하고 확인 신호를 추가하여 전략을 더욱 개선 할 수 있습니다.
/*backtest
start: 2023-01-08 00:00:00
end: 2024-01-14 00:00:00
period: 1d
basePeriod: 1h
exchanges: [{"eid":"Futures_Binance","currency":"BTC_USDT"}]
*/

// This source code is subject to the terms of the Mozilla Public License 2.0 at https://mozilla.org/MPL/2.0/
//
// @author Sunil Halai
//
// This script has been created to demonstrate the effectiveness of using market regime filters in your trading strategy, and how they can improve your returns and lower your drawdowns
//
// This strategy adds a simple filter (The historical volatility filter, which can be found on my trading profile) to a traditional buy and hold strategy of the index SPY. There are other filters
// that could also be added included a long term moving average / percentile rank filter / ADX filter etc, to improve the returns further.
//
// The filter added closes our long position during periods of volatility that exceed the 95th percentile (or in the top 5% of volatile days)
//
// Have included the back test results since 1993 which is 28 years of data at the time of writing,  Comparing  buy and hold of the SPY (S&P 500), to improved by and hold offered here.
//
// Traditional buy and hold:
//
// Return per year:     7.95   % (ex Dividends)
// Total return :       851.1  %
// Max drawdown:        50.79  %
//
// 'Modified' buy and hold (this script):
//
// Return per year:     9.92    % (ex Dividends)
// Total return:        1412.16 %
// Max drawdown:        31.57   %
//
// Feel free to use some of the market filters in my trading profile to improve and refine your strategies further, or make a copy and play around with the code yourself. This is just
// a simple example for demo purposes.
//

//@version=4
strategy(title = "Simple way to beat the market [STRATEGY]", shorttitle = "Beat The Market [STRATEGY]", overlay=true, initial_capital=100000, default_qty_type=strategy.percent_of_equity, currency="USD", default_qty_value=100)


upperExtreme = input(title = "Upper percentile filter (Do not trade above this number)", type = input.integer, defval = 95)
lookbackPeriod = input(title = "Lookback period", type = input.integer, defval = 100)

annual = 365
per = timeframe.isintraday or timeframe.isdaily and timeframe.multiplier == 1 ? 1 : 7
hv = lookbackPeriod * stdev(log(close / close[1]), 10) * sqrt(annual / per)

filtered = hv >= percentile_nearest_rank(hv, 100, upperExtreme)

if(not(filtered))
    strategy.entry("LONG", strategy.long)
else
    strategy.close("LONG")