개요
이 전략의 주요 아이디어는 단기 하락이 끝난 후 정기적으로 낮은 평균 가격을 추적하는 것이다. 구체적으로, 전략은 매월 말에 단기 하락이 끝난 때를 식별하여 주기적으로 포지션을 추가한다. 또한 마지막 K 선이 닫히면서 포지션을 청산한다.
전략 원칙
- 주기적으로 추적하는 신호 결정: 24*30개의 K선 ((한 달을 나타냅니다) 이후, 정기적 추적 지점에 도착한 것으로 판단되어 첫 번째 신호를 출력한다.
- 단기 하락의 끝 판단: MACD 지표를 사용하여 트렌드를 판단하고, MACD가 회전하여 신호선을 통과하면 단기 하락이 끝이라고 본다.
- 입문 규칙: 정기적 추적 신호와 단기 하락 종료 신호가 동시에 충족되면 추적 신호를 방출하고, 더 많은 포지션을 개설한다.
- 출구 규칙: 마지막 K 라인이 종료될 때 모든 포지션을 청산한다.
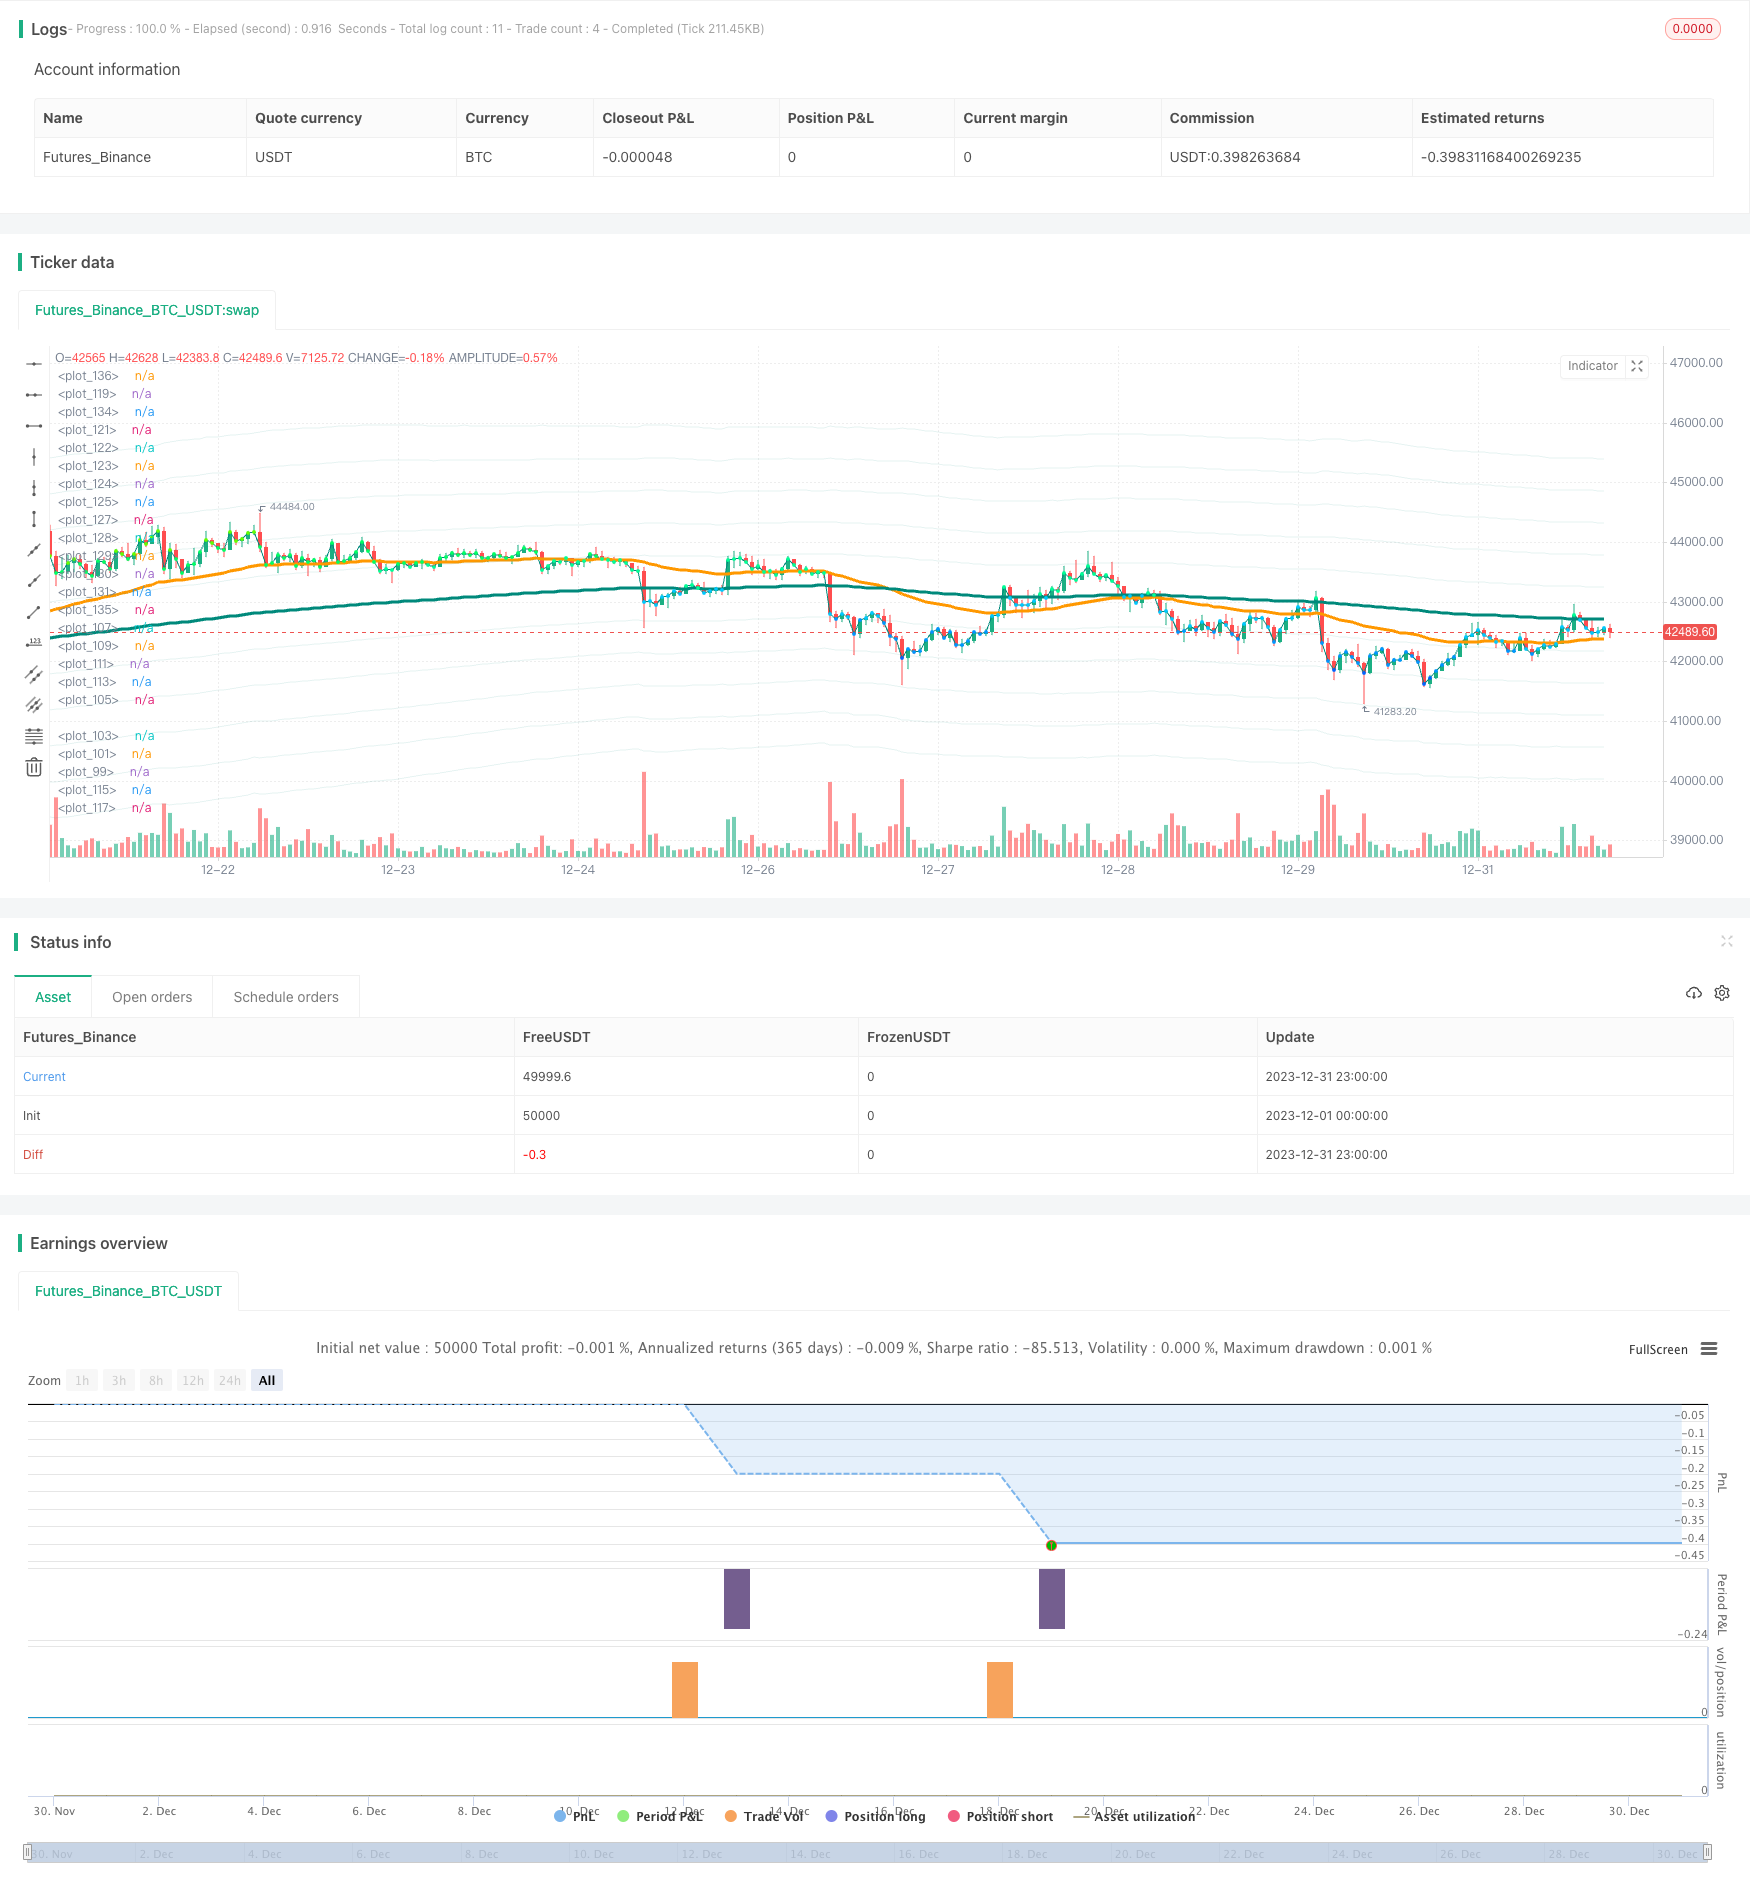
이 전략의 기본 거래 과정과 원리는 다음과 같습니다. 주목할 점은, 전략은 기본적으로 매달 1000달러의 자금 추적을 사용하지만, 백테스트에서는 33개월까지 확장하여 총 3만3000달러를 투입한다는 것입니다.
우위 분석
이 전략의 가장 큰 장점은 낮은 수준에서 주기적으로 상장을 할 수 있다는 점이며, 장기적으로 비교적 유리한 구매 비용을 얻을 수 있으며, 비교적 높은 수익률을 창출할 수 있다. 또한 MACD 지표를 사용하여 단기 구매 지점을 식별하는 것도 비교적 신뢰할 수 있고 명확하며, 교착 상태에 빠지지 않으며, 이는 손실을 어느 정도 피할 수 있다.
전체적으로, 이것은 비용-비용의 전략이며, 중·장기 라인 보유자가 정기적으로 대량으로 구매하는 것이 더 적합하며, 만족스러운 수익률을 얻을 수 있습니다.
위험과 해결책
전략의 주요 위험은 단기 하락의 끝점을 정확하게 판단할 수 없다는 데 있다. MACD 지표가 하락의 끝을 판단하는 시기가 지연될 수 있으며, 이는 비용으로 최적에서 구매할 수 없게 만든다. 게다가 자금 분산 투자는 또한 운영 비용을 증가시킨다.
트렌드를 판단하기 위해 더 많은 지표를 추가하는 것을 고려할 수 있습니다. 브린 라인, KDJ 등과 같은 지표는 반전의 시간을 미리 판단 할 수 있습니다. 또한 운영 비용의 수익에 대한 영향을 줄이기 위해 월간 투자 금액을 최적화 할 수 있습니다.
최적화 방향
이 전략은 다음의 몇 가지 측면에서 더욱 개선될 수 있습니다.
정기적 추적의 시기를 최적화하여 2개월마다 정기적으로 추적하는 것으로 변경하여 너무 빈번한 거래 문제를 줄입니다.
더 많은 지표와 함께 단기 하락의 종말을 판단하여 구매 지점을 최저 지점으로 더 가깝게 만듭니다.
월간 투자 금액을 최적화하여 최적의 분배를 찾습니다.
이 중에서도 손해를 막는 전략도 포함하고, 너무 깊게 떨어지는 것을 피하는 것이 좋습니다.
다른 포지션 주기가 수익에 미치는 영향을 테스트하고 최적의 포지션 날짜를 찾습니다.
요약하다
이 주기적으로 추적 하계 평평 가격 전략 전체 아이디어는 명확하고 이해하기 쉽다. 정기적 인 추가와 단기 판단 결합을 통해 유리한 비용 가격을 얻을 수 있다. 중장기 라인을 보유하는 이 전략은 안정적인 수익을 얻을 수 있으며, 장기 투자 가치를 추구하는 투자자에게 적합하다. 또한 몇 가지 최적화 할 수있는 방향이 있으며, 이 전략을 더욱 개선하여 성과를 한 층 높일 수 있도록 주의를 기울일 수 있습니다.
/*backtest
start: 2023-12-01 00:00:00
end: 2023-12-31 23:59:59
period: 1h
basePeriod: 15m
exchanges: [{"eid":"Futures_Binance","currency":"BTC_USDT"}]
*/

// This source code is subject to the terms of the Mozilla Public License 2.0 at https://mozilla.org/MPL/2.0/
// © BHD_Trade_Bot

// @version=5
strategy(
 shorttitle            = 'DCA After Downtrend v2',
 title                 = 'DCA After Downtrend v2 (by BHD_Trade_Bot)',
 overlay               = true,
 calc_on_every_tick    = false,
 calc_on_order_fills   = false,
 use_bar_magnifier     = false,
 pyramiding            = 1000,
 initial_capital       = 0,
 default_qty_type      = strategy.cash,
 default_qty_value     = 1000,
 commission_type       = strategy.commission.percent,
 commission_value      = 1.1)


// Backtest Time Period
start_year   = input(title='Start year'   ,defval=2017)
start_month  = input(title='Start month'  ,defval=1)
start_day    = input(title='Start day'    ,defval=1)
start_time   = timestamp(start_year, start_month, start_day, 00, 00)

end_year     = input(title='end year'     ,defval=2050)
end_month    = input(title='end month'    ,defval=1)
end_day      = input(title='end day'      ,defval=1)
end_time     = timestamp(end_year, end_month, end_day, 23, 59)

window() => time >= start_time and time <= end_time ? true : false
h1_last_bar = (math.min(end_time, timenow) - time)/1000/60/60 < 2


// EMA
ema50 = ta.ema(close, 50)
ema200 = ta.ema(close, 200)

// EMA_CD
emacd = ema50 - ema200
emacd_signal = ta.ema(emacd, 20)
hist = emacd - emacd_signal

// BHD Unit
bhd_unit = ta.rma(high - low, 200) * 2
bhd_upper = ema200 + bhd_unit
bhd_upper2 = ema200 + bhd_unit * 2
bhd_upper3 = ema200 + bhd_unit * 3
bhd_upper4 = ema200 + bhd_unit * 4
bhd_upper5 = ema200 + bhd_unit * 5

bhd_lower = ema200 - bhd_unit
bhd_lower2 = ema200 - bhd_unit * 2
bhd_lower3 = ema200 - bhd_unit * 3
bhd_lower4 = ema200 - bhd_unit * 4
bhd_lower5 = ema200 - bhd_unit * 5

// Count n candles after x long entries
var int nPastCandles = 0
var int entryNumber = 0
if window()
    nPastCandles := nPastCandles + 1


// ENTRY CONDITIONS

// 24 * 30 per month
entry_condition1 = nPastCandles > entryNumber * 24 * 30

// End of downtrend
entry_condition2 = emacd < 0 and hist < 0 and hist > hist[2]

ENTRY_CONDITIONS = entry_condition1 and entry_condition2


if ENTRY_CONDITIONS
    entryNumber := entryNumber + 1
    entryId = 'Long ' + str.tostring(entryNumber)
    strategy.entry(entryId, strategy.long)


// CLOSE CONDITIONS

// Last bar
CLOSE_CONDITIONS = barstate.islast or h1_last_bar

if CLOSE_CONDITIONS
    strategy.close_all()


// Draw
colorRange(src) =>
    if src > bhd_upper5
        color.rgb(255,0,0)
    else if src > bhd_upper4
        color.rgb(255,150,0)
    else if src > bhd_upper3
        color.rgb(255,200,0)
    else if src > bhd_upper2
        color.rgb(100,255,0)
    else if src > bhd_upper
        color.rgb(0,255,100)
    else if src > ema200
        color.rgb(0,255,150)
    else if src > bhd_lower
        color.rgb(0,200,255)
    else if src > bhd_lower2
        color.rgb(0,150,255)
    else if src > bhd_lower3
        color.rgb(0,100,255)
    else if src > bhd_lower4
        color.rgb(0,50,255)
    else
        color.rgb(0,0,255)

bhd_upper_line = plot(bhd_upper, color=color.new(color.teal, 90))
bhd_upper_line2 = plot(bhd_upper2, color=color.new(color.teal, 90))
bhd_upper_line3 = plot(bhd_upper3, color=color.new(color.teal, 90))
bhd_upper_line4 = plot(bhd_upper4, color=color.new(color.teal, 90))
bhd_upper_line5 = plot(bhd_upper5, color=color.new(color.teal, 90))

bhd_lower_line = plot(bhd_lower, color=color.new(color.teal, 90))
bhd_lower_line2 = plot(bhd_lower2, color=color.new(color.teal, 90))
bhd_lower_line3 = plot(bhd_lower3, color=color.new(color.teal, 90))
bhd_lower_line4 = plot(bhd_lower4, color=color.new(color.teal, 90))
bhd_lower_line5 = plot(bhd_lower5, color=color.new(color.teal, 90))
// fill(bhd_upper_line5, bhd_lower_line5, color=color.new(color.teal, 95))

plot(ema50, color=color.orange, linewidth=3)
plot(ema200, color=color.teal, linewidth=3)
plot(close, color=color.teal, linewidth=1)
plot(close, color=colorRange(close), linewidth=3, style=plot.style_circles)