개요
참을성 트렌드 추적 전략은 트렌드 따르는 전략이다. 그것은 이동 평균의 지표 조합을 사용하여 트렌드 방향을 판단하고, 오버 바이 오버 셀 지표 CCI와 결합하여 거래 신호를 발산한다. 이 전략은 큰 트렌드를 추구하고, 충격적인 상황에서 피지를 효과적으로 피할 수 있다.
전략 원칙
이 전략은 21주기 및 55주기 EMA의 조합을 사용하여 트렌드 방향을 판단한다. 단기 EMA가 장기 EMA 위에 있을 때 상승 트렌드로 정의되고, 단기 EMA가 장기 EMA 아래에 있을 때 하락 트렌드로 정의된다.
CCI 지표는 과매매를 판단하기 위해 사용된다. CCI 상단 100선을 넘기는 것은 하단 과매매 신호이며, 하단 100선을 넘기는 것은 상단 과매 신호이다. CCI 지표의 다른 과매 과매매 신호에 따라, 전략은 세 가지 거래 신호 강도 수준으로 나다.
상승 추세로 판단할 때, CCI 지표가 강한 하위 오버셀 신호를 발산하면 다단으로 입시한다. 하향 추세로 판단할 때, CCI 지표가 강한 상위 오버셀 신호를 발산하면 공백으로 입시한다.
스톱 라인은 슈퍼 트렌드 지표로 설정되며, 목표 수익은 고정 포인트로 설정됩니다.
우위 분석
이 전략은 다음과 같은 장점을 가지고 있습니다.
- 큰 트렌드를 추적하고 함정에 빠지지 마세요.
- CCI 지표는 반전 지점을 효과적으로 판단할 수 있습니다.
- 수퍼트렌드 스톱 라인 설정이 합리적입니다.
- 고정 스톱 및 고정 스톱, 위험 제어
위험 분석
이 전략에는 다음과 같은 위험들이 있습니다.
- 그 결과, 그 추세에 대한 잘못된 판단의 확률은
- CCI 지표가 잘못된 신호를 보내는 확률
- 스톱포인트가 너무 거나 너무 깊어서 불필요한 스톱포인트가 발생할 확률
- 고정 스톱이 트렌드를 지속적으로 추적하지 못하는 확률
이러한 위험에는 EMA 주기 변수, CCI 변수 및 스톱포인트 지점을 조정하여 최적화 할 수 있습니다. 전략적 신호 검증을 위해 더 많은 지표를 도입하는 것도 필요합니다.
최적화 방향
이 전략의 최적화 방향은 다음과 같습니다.
더 많은 조합을 테스트하여 더 나은 추세 판단과 신호 검증 지표를 찾아라.
트렌드를 더 잘 추적하고 위험을 제어하기 위해 ATR의 동적 스톱 스톱을 사용하십시오.
트렌드 확률을 판단하기 위해 역사적 데이터 훈련에 기반한 기계 학습 모델을 도입한다.
다양한 품종의 매개 변수에 맞게 조정 최적화.
요약하다
인내 트렌드 추적 전략은 전체적으로 매우 실용적인 트렌드 추적 전략이다. 그것은 이동 평균을 사용하여 큰 트렌드 방향을 판단하고, CCI 지표는 반전 지점 신호를 발견하고, 슈퍼 트렌드 스톱 라인을 설정하는 것이 합리적입니다. 파라미터 조정과 다중 지표 조합 검증으로 이 전략은 더 이상 최적화 할 수 있으며, 장기 실물 추적 검증 가치가있다.
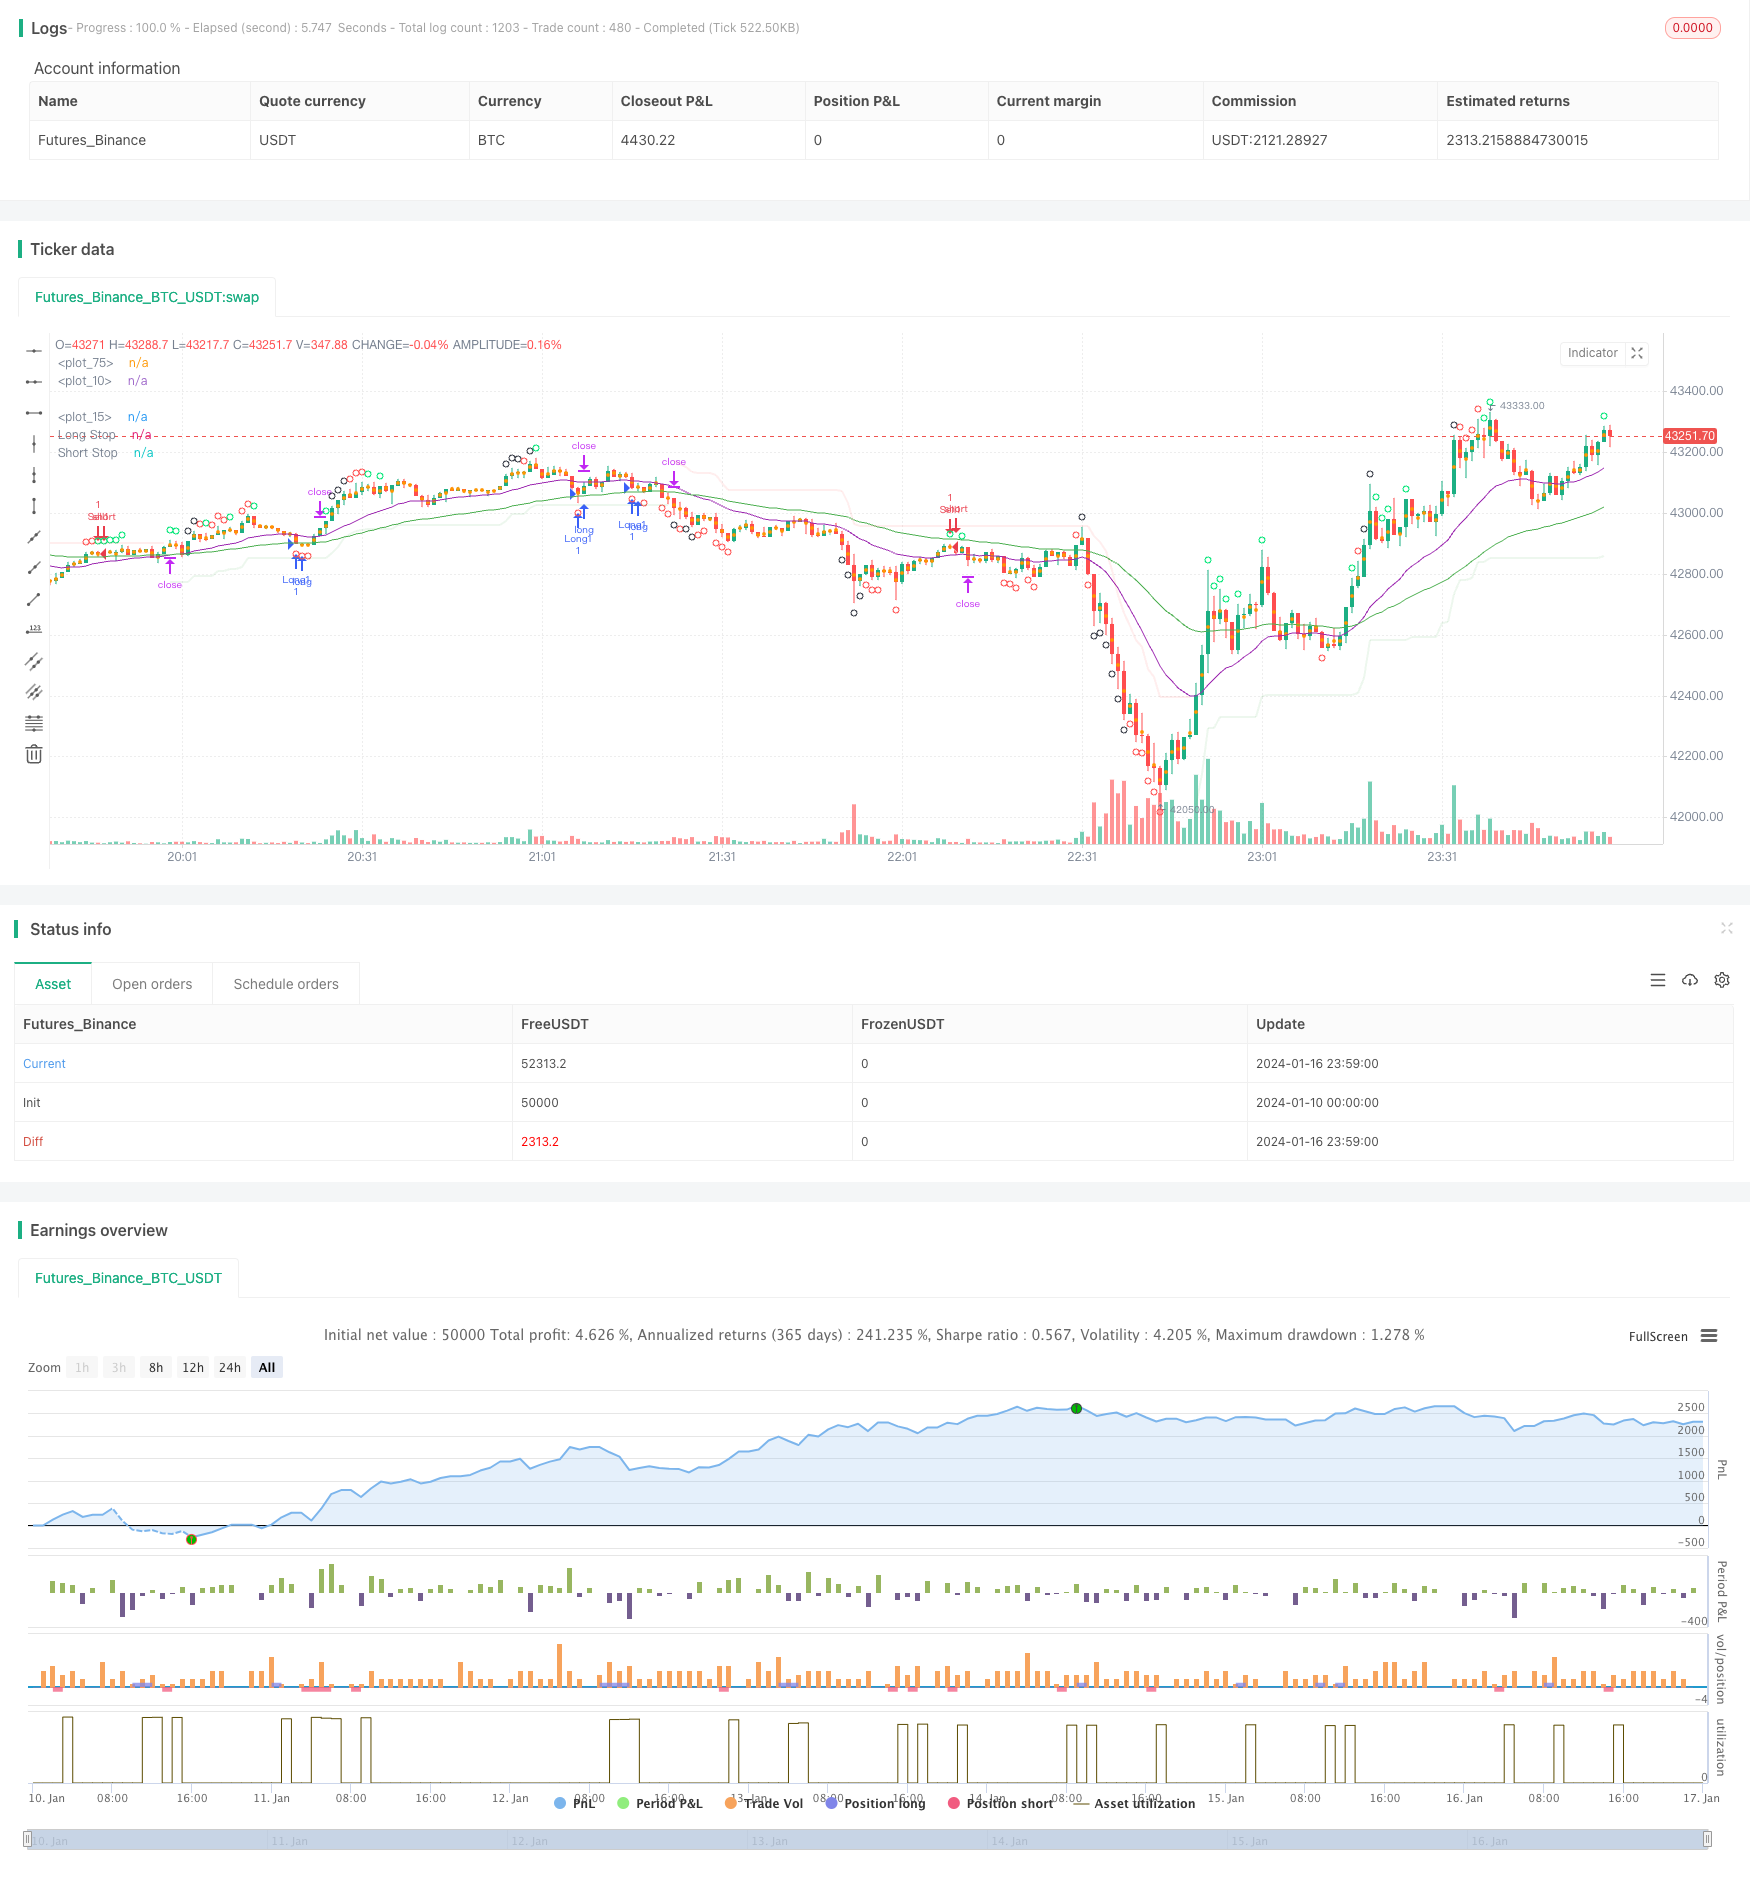
/*backtest
start: 2024-01-10 00:00:00
end: 2024-01-17 00:00:00
period: 1m
basePeriod: 1m
exchanges: [{"eid":"Futures_Binance","currency":"BTC_USDT"}]
*/

// This source code is subject to the terms of the Mozilla Public License 2.0 at https://mozilla.org/MPL/2.0/
// © greenmask9

//@version=4
strategy("Patient Trendfollower (7) Strategy", overlay=true)

// 21 EMA
emalength = input(21, title="Short EMA")
emashort = ema(close, emalength)
plot(emashort, color = color.purple, linewidth=1)

// 55 EMA
emalength2 = input(55, title="Long EMA")
ema = ema(close, emalength2)
plot(ema, color = color.green, linewidth=1)

//CCI calculation and inputs
lengthcci = input(20, minval=1, title="Overbought/sold detector period")
src = input(close, title="Overbought/sold detector source")
ma = sma(src, lengthcci)
ccivalue = (src - ma) / (0.015 * dev(src, lengthcci))


//CCI plotting
ccioverbought = input(defval=100, title="Overbought level 1")
ccioverbought2 = input(defval=140, title="Overbought level 2")
ccioverbought3 = input(defval=180, title="Overbought level 3")

ccioversold = input(defval=-100, title="Oversold level 1")
ccioversold2 = input(defval=-140, title="Oversold level 2")
ccioversold3 = input(defval=-180, title="Oversold level 3")

cciOB = (ccivalue >= ccioverbought and ccivalue < ccioverbought2)
plotshape(cciOB,  title= "Overbought", location=location.abovebar, color=color.lime, transp=0, style=shape.circle)
cciOS = (ccivalue <= ccioversold and ccivalue > ccioversold2)
plotshape(cciOS, title= "Oversold", location=location.belowbar, color=color.lime, transp=0, style=shape.circle)

cciOB2 = (ccivalue >= ccioverbought2 and ccivalue < ccioverbought3)
plotshape(cciOB2,  title= "Overbought", location=location.abovebar, color=color.red, transp=0, style=shape.circle)
cciOS2 = (ccivalue <= ccioversold and ccivalue > ccioversold3)
plotshape(cciOS2, title= "Oversold", location=location.belowbar, color=color.red, transp=0, style=shape.circle)

cciOB3 = (ccivalue >= ccioverbought3)
plotshape(cciOB3,  title= "Overbought", location=location.abovebar, color=color.black, transp=0, style=shape.circle)
cciOS3 = (ccivalue <= ccioversold3)
plotshape(cciOS3, title= "Oversold", location=location.belowbar, color=color.black, transp=0, style=shape.circle)

//Supertrend

length = input(title="ATR Period", type=input.integer, defval=55)
mult = input(title="ATR Multiplier", type=input.float, step=0.1, defval=5.0)
wicks = input(title="Take Wicks into Account ?", type=input.bool, defval=true)
illuminate = input(title="Illuminate Trend", type=input.bool, defval=true)

atr = mult * atr(length)

longStop = hl2 - atr
longStopPrev = nz(longStop[1], longStop)
longStop := (wicks ? low[1] : close[1]) > longStopPrev ? max(longStop, longStopPrev) : longStop

shortStop = hl2 + atr
shortStopPrev = nz(shortStop[1], shortStop)
shortStop := (wicks ? high[1] : close[1]) < shortStopPrev ? min(shortStop, shortStopPrev) : shortStop

dir = 1
dir := nz(dir[1], dir)
dir := dir == -1 and (wicks ? high : close) > shortStopPrev ? 1 : dir == 1 and (wicks ? low : close) < longStopPrev ? -1 : dir

longColor = color.new(color.green, 90)
shortColor = color.new(color.red, 90)
noneColor = color.new(color.white, 100)

longStopPlot = plot(dir == 1 ? longStop : na, title="Long Stop", style=plot.style_linebr, linewidth=2, color=longColor)
shortStopPlot = plot(dir == 1 ? na : shortStop, title="Short Stop", style=plot.style_linebr, linewidth=2, color=shortColor)
midPricePlot = plot(ohlc4, title="", style=plot.style_circles, linewidth=0)

longFillColor = illuminate ? (dir == 1 ? longColor : noneColor) : noneColor
shortFillColor = illuminate ? (dir == -1 ? shortColor : noneColor) : noneColor
fill(midPricePlot, longStopPlot, title="Long State Filling", color=longFillColor)
fill(midPricePlot, shortStopPlot, title="Short State Filling", color=shortFillColor)

//entries
uptrend = emashort>ema and dir == 1
upsignal = ccivalue<=ccioversold and ccivalue>ccioversold2
upsignal2 = ccivalue<=ccioversold2 and ccivalue>ccioversold3
upsignal3 = ccivalue<=ccioversold3
downtrend = emashort<ema and dir == -1
downsignal = ccivalue>=ccioverbought and ccivalue<ccioverbought2
downsignal2 = ccivalue>=ccioverbought2 and ccivalue<ccioverbought3
downsignal3 = ccivalue>=ccioverbought3

//adapts to the current bar, I need to save the bars number when the condition for buy was true, static number is spread
spread = input (0.00020, title="Spread")
upstoploss = longStop - spread
downstoploss = shortStop + spread
strategy.initial_capital = 50000
ordersize=floor(strategy.initial_capital/close)
testlong = input(title="Test longs", type=input.bool, defval=true)
testshort = input(title="Test shorts", type=input.bool, defval=true)
//new
degree = input(title="Test level 1 overbought/sold levels", type=input.bool, defval=true)
degree2 = input(title="Test level 2 overbought/sold levels", type=input.bool, defval=false)
degree3 = input(title="Test level 3 overbought/sold levels", type=input.bool, defval=false)

statictarget = input(title="Use static target", type=input.bool, defval=true)
statictargetvalue = input(title="Static target in pips", type=input.integer, defval=400)

//timetrade = input(title="Open trades only withing specified time", type=input.bool, defval=true)
//timtrade = input()

//přidat možnost TP podle ATR a sl podle ATR
buy1 = uptrend and upsignal and strategy.opentrades==0 and testlong and degree
x1 = barssince (buy1)
if (buy1)
//bodlo by zakázat atrtarget v tomto případě
    if (statictarget)
        strategy.entry("Long1", strategy.long, ordersize)
        strategy.exit( "Exitlong", from_entry="Long1" , profit=statictargetvalue,stop=upstoploss[x1])

buy2 = uptrend and upsignal2 and strategy.opentrades==0 and testlong and degree2
x2 = barssince (buy2)
if (buy2)
//bodlo by zakázat atrtarget v tomto případě
    if (statictarget)
        strategy.entry("Long2", strategy.long, ordersize)
        strategy.exit( "Exitlong", from_entry="Long2" , profit=statictargetvalue,stop=upstoploss[x2])

buy3 = uptrend and upsignal3 and strategy.opentrades==0 and testlong and degree3
x3 = barssince (buy3)
if (buy3)
//bodlo by zakázat atrtarget v tomto případě
    if (statictarget)
        strategy.entry("Long3", strategy.long, ordersize)
        strategy.exit( "Exitlong", from_entry="Long3" , profit=statictargetvalue,stop=upstoploss[x3])

sell1 = downtrend and downsignal and strategy.opentrades==0 and testshort and degree
y1 = barssince (sell1)
if (sell1)
    if (statictarget)
        strategy.entry("Sell1", strategy.short, ordersize)
        strategy.exit( "Exitshort", from_entry="Sell1" , profit=statictargetvalue,stop=downstoploss[y1])

sell2 = downtrend and downsignal2 and strategy.opentrades==0 and testshort and degree2
y2 = barssince (sell2)
if (sell2)
    if (statictarget)
        strategy.entry("Sell2", strategy.short, ordersize)
        strategy.exit( "Exitshort", from_entry="Sell2" , profit=statictargetvalue,stop=downstoploss[y2])

sell3 = downtrend and downsignal3 and strategy.opentrades==0 and testshort and degree3
y3 = barssince (sell3)
if (sell3)
    if (statictarget)
        strategy.entry("Sell3", strategy.short, ordersize)
        strategy.exit( "Exitshort", from_entry="Sell3" , profit=statictargetvalue,stop=downstoploss[y3])