개요
이 전략은 상대적으로 강한 지수 ((RSI) 를 기반으로 역전 추세를 추적하는 ETF 거래 전략이다. RSI 지표를 통해 단기 오버 바이 오버 소드를 판단하고, 역전 엔트리와 엑시트를 수행하며, 200 일 이동 평균을 결합하여 전반적인 경향 방향을 판단한다.
전략 원칙
이 전략의 핵심 논리는 RSI 지표의 역전 원칙에 기초한다. RSI 지표는 일정 기간 동안의 평균 상승률을 계산하여 거래 품종이 과매매 상태인지 여부를 판단한다. RSI가 70보다 높으면 과매매를 의미하고 RSI가 30보다 낮으면 과매를 의미한다.
이 전략은 이 원칙을 사용하여 당일 RSI를 조정 가능한 변수보다 낮게 설정합니다.TodaysMinRSI3일 전 RSI가 조정 가능한 변수보다 낮았습니다.Day3RSIMax시점에, 구매를 할 수 있다. 이것은 가격이 단기 오버셀 영역에 있을 수 있음을 의미하며, 반전이 있을 가능성이 있다. 또한 3일 이내에 RSI가 하향 경향을 보이고, 즉 RSI가 계속 하락하기 전에 구매를 하고, 가짜 반전을 피한다.
전략의 출구 메커니즘은 RSI 지표가 다시 조정 가능한 변수를 초과 할 때입니다.Exit RSI이 때, 평준출장마사지 (平仓退出) 가 진행된다.
이 전략은 또한 200일 이동 평균을 전체적인 추세를 판단하기 위해 도입한다. 가격이 200일선보다 높을 때만 구매를 할 수 있다. 이것은 추세 상향 단계에서만 구매를 보장하고 역전 거래의 위험을 피하는 데 도움이 된다.
전략적 강점 분석
- RSI를 이용해서 과매매를 판단하면 bellion이 나올 가능성이 높습니다.
- 200일선과 함께 큰 트렌드 방향을 판단하는 것은 역동적인 거래를 피하는 데 도움이 됩니다.
- RSI 역전 거래 원칙은 고전적이고 신뢰할 수 있으며 성공률이 높습니다.
- 조정 가능한 매개 변수는 유연성을 제공하여 다양한 품종에 최적화 할 수 있습니다.
위험과 해결책
- RSI 지표에 허위 돌파가 있을 가능성이 있어 손실을 완전히 피할 수 없다. 단편 손실을 제어하기 위해 손해 중지 설정을 할 수 있다.
- 역전 실패는 손실을 확대할 수 있다. 지분 보유 시간을 단축하고 적당히 손실을 중단할 수 있다.
- 잘못된 매개 변수 설정으로 인해 너무 급진적이거나 너무 보수적이어서 거래 기회를 놓치게 될 수 있습니다. 품종에 대한 매개 변수 최적화 테스트가 필요합니다.
최적화 방향
- KDJ, 브린 띠 등과 같은 다른 지표 결합을 추가하여 지표 포괄을 형성하여 신호의 정확도를 높인다.
- 이동식 스톱 전략이 추가되어 스톱 레벨이 변동할 수 있도록 하여 손실을 줄일 수 있습니다.
- 거래량이나 자금 관리 모듈을 늘리고 거래당 리스크 을 제어한다.
- 다양한 품종의 매개 변수를 최적화하고 재검토하고, 적절한 품종에 적합한 매개 변수 조합을 개발한다.
요약하다
이 전략은 RSI 지표의 클래식 구매 판매 포인트 원리를 사용하여 오버 구매 오버 판매 지역을 판단하여 역전입 및 출구를 수행한다. 큰 추세 판단과 변수 최적화 공간을 고려하면서 신뢰성이 높은 단기 역전 ETF 전략이다. 추가 최적화를 통해 실전 효과의 양적 전략이 될 수 있다.
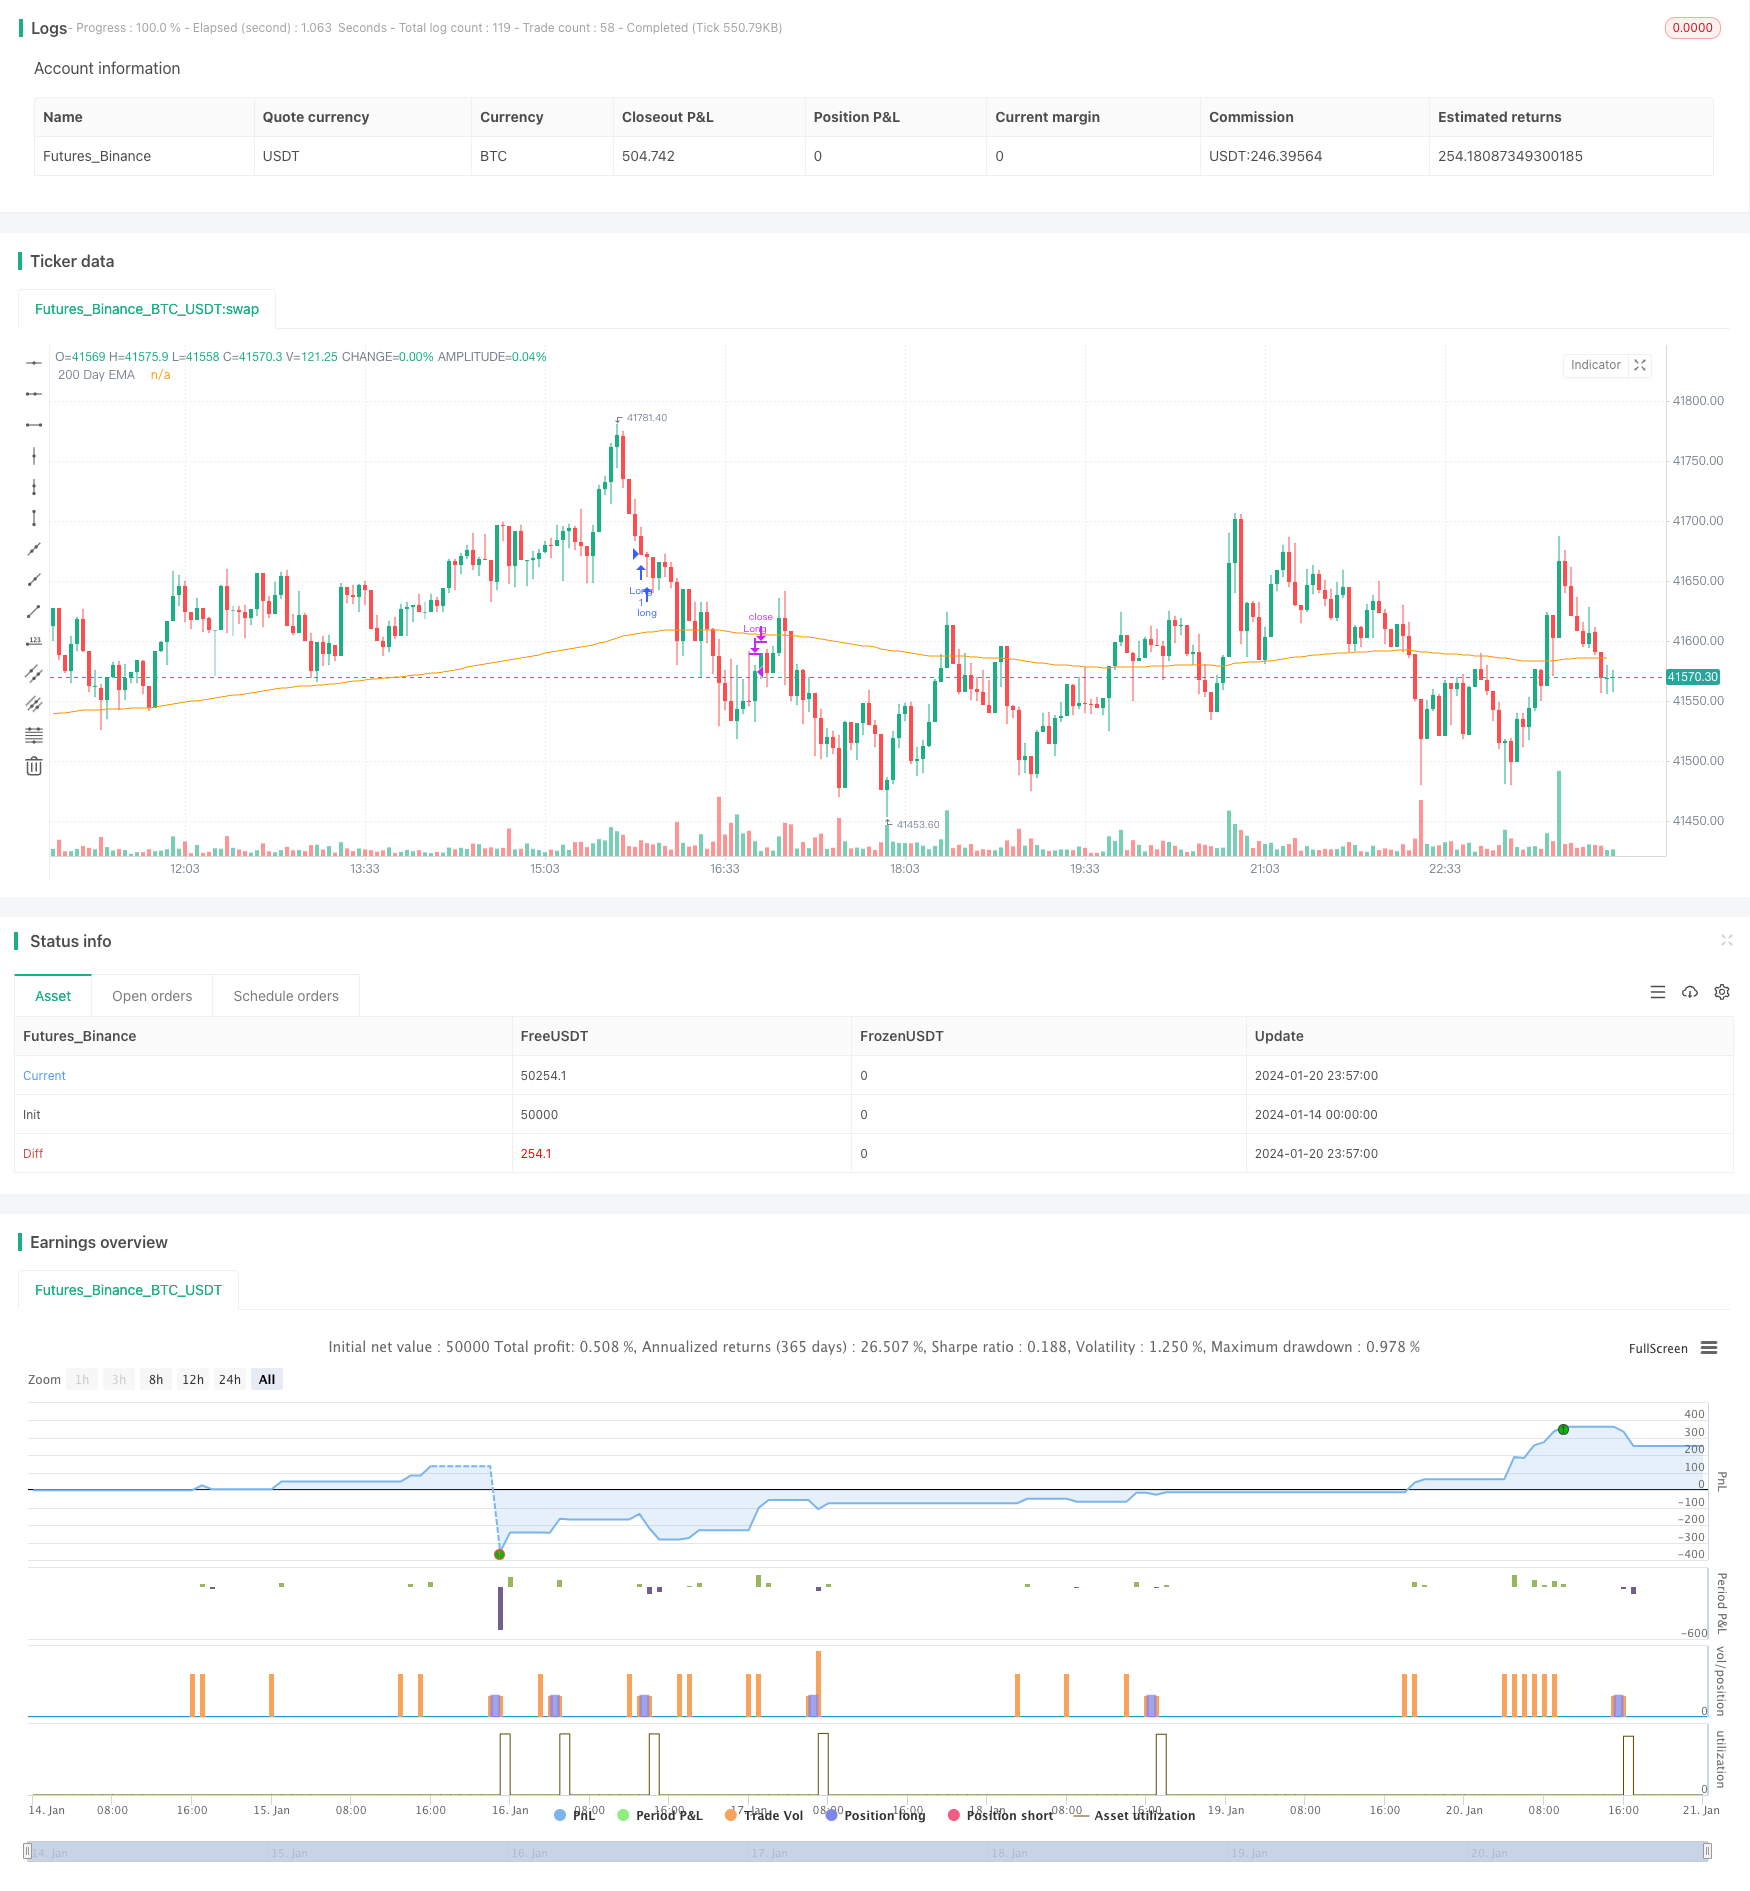
/*backtest
start: 2024-01-14 00:00:00
end: 2024-01-21 00:00:00
period: 3m
basePeriod: 1m
exchanges: [{"eid":"Futures_Binance","currency":"BTC_USDT"}]
*/

// This source code is subject to the terms of the Mozilla Public License 2.0 at https://mozilla.org/MPL/2.0/
// @version = 5
// Author = TradeAutomation


strategy(title="R3 ETF Strategy", shorttitle="R3 ETF Strategy", overlay=true)


// Backtest Date Range Inputs //
StartTime = input(defval=timestamp('01 Jan 2012 05:00 +0000'), title='Start Time')
EndTime = input(defval=timestamp('01 Jan 2099 00:00 +0000'), title='End Time')
InDateRange = true

// Calculations and Inputs //
RSILen = input.int(2, "RSI Length")
RSI = ta.rsi(close, RSILen)
TodaysMinRSI = input.int(10, "Today's Min RSI for Entry", tooltip = "The RSI must be below this number today to qualify for trade entry")
Day3RSIMax = input.int(60, "Max RSI 3 Days Ago for Entry", tooltip = "The RSI must be below this number 3 days ago to qualify for trade entry")
EMA = ta.ema(close, 200)

// Strategy Rules //
Rule1 = close>ta.ema(close, 200)
Rule2 = RSI[3]<Day3RSIMax and RSI<TodaysMinRSI
Rule3 = RSI<RSI[1] and RSI[1]<RSI[2] and RSI[2]<RSI[3]
Exit = ta.crossover(RSI, input.int(70, "Exit RSI", tooltip = "The strategy will sell when the RSI crosses over this number"))

// Plot //
plot(EMA, "200 Day EMA")

// Entry & Exit Functions //
if (InDateRange)
    strategy.entry("Long", strategy.long, when = Rule1 and Rule2 and Rule3)
//    strategy.close("Long", when = ta.crossunder(close, ATRTrailingStop))
    strategy.close("Long", when = Exit)
if (not InDateRange)
    strategy.close_all()