개요
동치안 채널 브레이크 전략은 트렌드 추적 전략으로, 일정 기간 동안의 최고 가격과 최저 가격을 계산하여 가격 채널을 형성하고 채널 경계를 구매 및 판매 신호로 사용합니다. 가격이 궤도를 돌파 할 때, 공백을 만들고, 가격이 궤도를 돌파 할 때, 더 많은 것을합니다. 이 전략은 높은 변동성있는 디지털 통화 거래에 적용됩니다.
전략 원칙
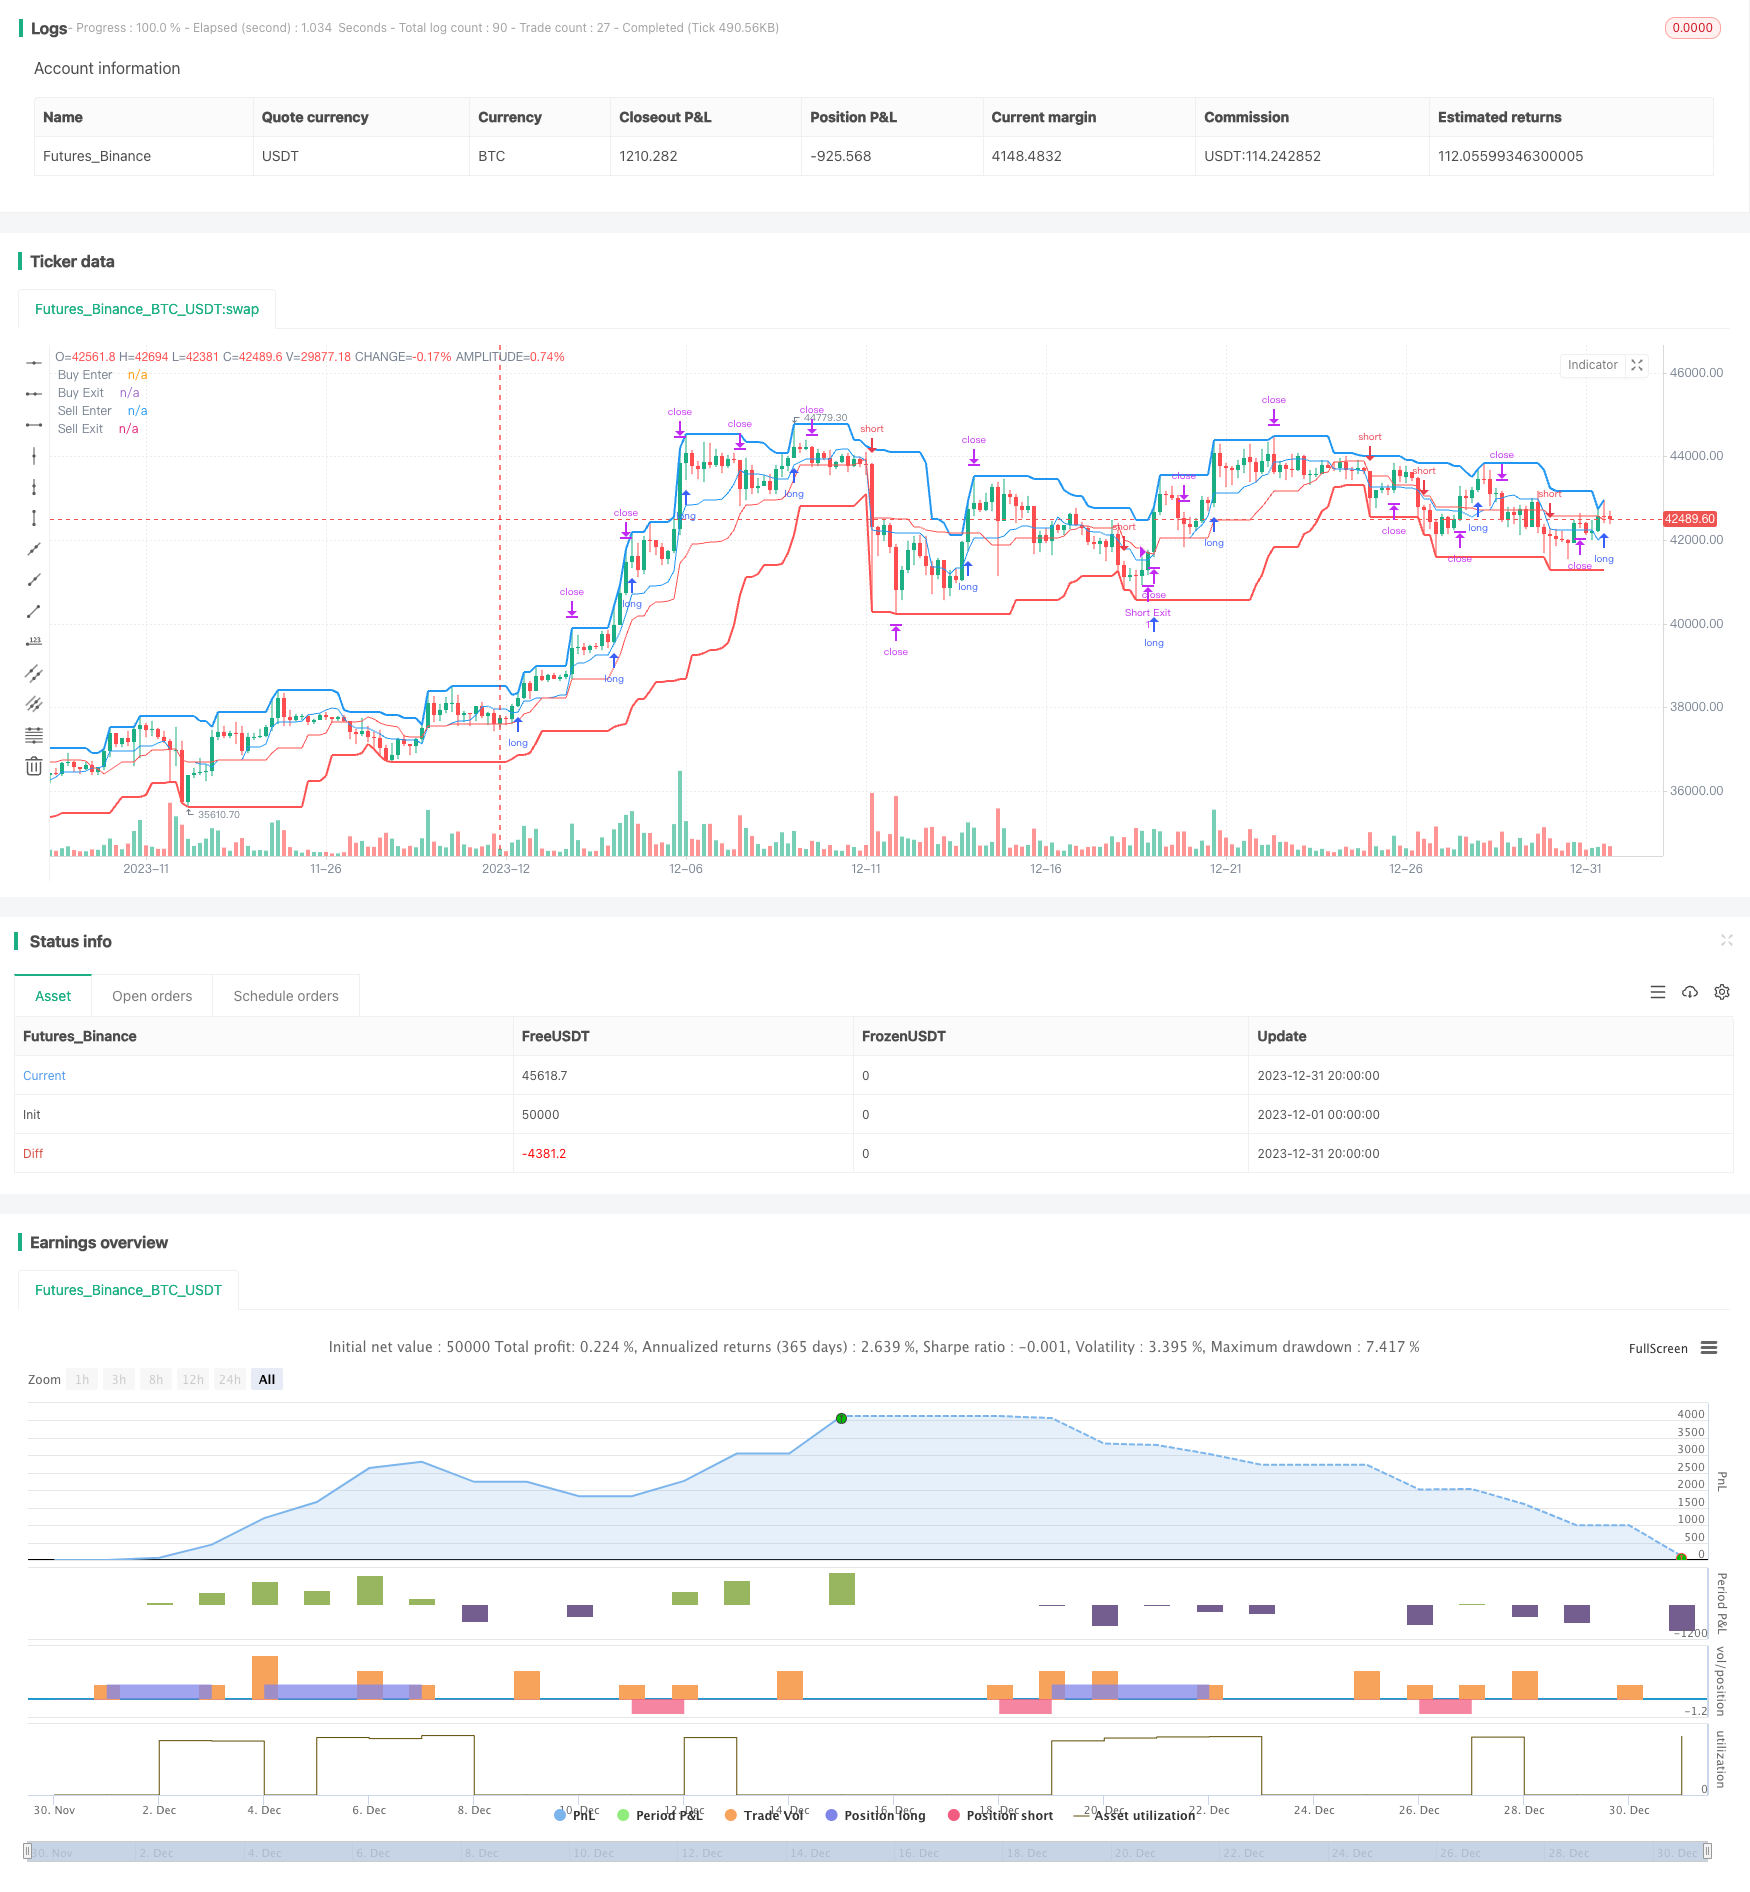
이 전략은 가격 동향을 판단하고 입출구를 계산하기 위해 둥지안 통로 지표를 사용합니다. 둥지안 통로는 상반, 하반, 중반으로 구성됩니다. 상반은 일정 기간 동안의 최고 가격, 하반은 최저 가격, 중반은 평균 가격입니다.
입구와 출구 사이클의 길이는 독립적으로 구성할 수 있다. 가격이 상향으로 하향 궤도를 돌파할 때, 더 많은 입구를 한다. 가격이 하향으로 상향 궤도를 돌파할 때, 공백 입구를 한다. 출구 지점은 가격이 다시 해당 궤도를 만지는 것을 의미한다. 또한 중간 궤도를 손실선으로 선택 할 수 있다.
또한, 전략에는 정지점이 설정되어 있다. 다중 포지션의 정지 가격은 출입 가격에 대한 ((1+정지 비율), 공백 포지션은 반대로 있다. 이 기능을 활성화하면 수익을 잠금화하여 손실 확산을 방지할 수 있다.
전체적으로, 이 전략은 추세를 판단하면서도 스톱로즈와 스톱을 설정할 수 있는 충분한 공간을 보장한다. 이는 특히 디지털 화폐와 같은 변동성이 높은 품종에 적합하다.
우위 분석
이 전략은 다음과 같은 장점을 가지고 있습니다.
- 전략적 판단이 명확하고, 신호 생성이 간단하고 안정적이다.
- 동천 통로 지표는 가격 변동에 민감하지 않아 추세를 잡는 데 도움이 됩니다.
- 다양한 품종과 시간 주기에 맞게 커스터마이징할 수 있는 통로 파라미터.
- 내장된 손해 방지 기능으로 위험을 효과적으로 제어할 수 있다.
- 디지털 화폐와 같은 높은 변동성 품종에 적용되며 수익 잠재력이 높습니다.
위험 분석
이 전략에는 다음과 같은 위험도 있습니다.
- 하지만, 큰 손실의 위험을 완전히 피할 수는 없습니다.
- 잘못된 매개 변수 설정으로 인해 거래가 너무 빈번하게 이루어지고 거래비용이 증가하고 점진 위험이 증가할 수 있습니다.
- 이 전략은 가격 변동에 민감하지 않아 일부 거래 기회를 놓칠 수 있습니다.
위와 같은 위험을 통제하기 위해 다음과 같은 조치를 취하는 것이 좋습니다.
- 개별 투자자금을 적절히 줄이고, 투자 종류를 분산하고, 전반적인 위험을 통제하십시오.
- 최적화 매개 변수, 최적의 매개 변수 조합을 찾는다. 기계 학습과 같은 방법을 사용하여 자동 최적화를 시도할 수 있다.
- 추가적인 지표와 결합하여 브레이크 신호의 신뢰성을 판단하여 잘못된 거래를 피하십시오.
최적화 방향
이 전략은 다음과 같은 차원에서 더욱 최적화될 수 있습니다.
- 더 많은 조합을 테스트하고 최적화하여 최적의 파라미터를 찾습니다. 주요 파라미터는 통로 주기, 정지 비율, 추가 공백이 허용되는지 등입니다.
- 기계 학습 모델을 추가하여 최적의 매개 변수를 자동으로 식별한다. 강도 학습과 같은 방법을 사용할 수 있다.
- 다른 지표와 함께 트렌드를 판단하고, 평균선, 거래량 등과 같은 신호 신뢰도를 판단한다.
- 리스크를 더 제어하기 위해, 리스크 추적, 데리어 엑시트와 같은 리스크 차단 전략을 개발하십시오.
- 더 많은 품종으로 확장하여 이 전략에 가장 적합한 거래 품종을 찾아보세요.
요약하다
통진 통로 돌파 전략은 전체적으로 판단이 명확하고, 위험도 조절 가능한 트렌드 추적 전략이다. 이 전략은 특히 수익 가능성이 높은 디지털 화폐와 같은 변동성이 높은 품종에 적합하다. 동시에, 이 전략에는 특정 변수 최적화 공간과 다른 지표와 결합할 가능성이 있으며, 이는 향후 확장 가능한 방향이다. 지속적인 최적화와 혁신을 통해 이 전략은 디지털 화폐 알고리즘 거래의 중요한 선택이 될 전망이다.
/*backtest
start: 2023-12-01 00:00:00
end: 2023-12-31 23:59:59
period: 4h
basePeriod: 15m
exchanges: [{"eid":"Futures_Binance","currency":"BTC_USDT"}]
*/

// This source code is subject to the terms of the Mozilla Public License 2.0 at https://mozilla.org/MPL/2.0/
// © algotradingcc
// Strategy testing and optimisation for free trading bot

//@version=4
strategy("Donchian Channel Strategy [for free bot]", overlay=true )

//Long optopns
buyPeriodEnter = input(10, "Channel Period for Long enter position")
buyPeriodExit = input(10, "Channel Period for Long exit position")
isMiddleBuy = input(true, "Is exit on Base Line? If 'no' - exit on bottom line")
takeProfitBuy = input(2.5, "Take Profit (%) for Long position")
isBuy = input(true, "Allow Long?")

//Short Options
sellPeriodEnter = input(20, "Channel Period for Short enter position")
sellPeriodExit = input(20, "Channel Period for Short exit position")
isMiddleSell = input(true, "Is exit on Base Line? If 'no' - exit on upper line")
takeProfitSell = input(2.5, "Take Profit (%) for Short position")
isSell = input(true, "Allow Short?")

// Test Start
startYear = input(2005, "Test Start Year")
startMonth = input(1, "Test Start Month")
startDay = input(1, "Test Start Day")
startTest = timestamp(startYear,startMonth,startDay,0,0)

//Test End
endYear = input(2050, "Test End Year")
endMonth = input(12, "Test End Month")
endDay = input(30, "Test End Day")
endTest = timestamp(endYear,endMonth,endDay,23,59)

timeRange = time > startTest and time < endTest ? true : false

// Long&Short Levels
BuyEnter = highest(buyPeriodEnter)
BuyExit = isMiddleBuy ? ((highest(buyPeriodExit) + lowest(buyPeriodExit)) / 2): lowest(buyPeriodExit)

SellEnter = lowest(sellPeriodEnter)
SellExit = isMiddleSell ? ((highest(sellPeriodExit) + lowest(sellPeriodExit)) / 2): highest(sellPeriodExit)

// Plot Data
plot(BuyEnter, style=plot.style_line, linewidth=2, color=color.blue, title="Buy Enter")
plot(BuyExit, style=plot.style_line, linewidth=1, color=color.blue, title="Buy Exit", transp=50)
plot(SellEnter, style=plot.style_line, linewidth=2, color=color.red, title="Sell Enter")
plot(SellExit, style=plot.style_line, linewidth=1, color=color.red, title="Sell Exit", transp=50)

// Calc Take Profits
TakeProfitBuy = 0.0
TakeProfitSell = 0.0
if strategy.position_size > 0
    TakeProfitBuy := strategy.position_avg_price*(1 + takeProfitBuy/100)

if strategy.position_size < 0
    TakeProfitSell := strategy.position_avg_price*(1 - takeProfitSell/100)

// Long Position
if isBuy and timeRange
    strategy.entry("Long", strategy.long, stop = BuyEnter, when = strategy.position_size == 0)

strategy.exit("Long Exit", "Long", stop=BuyExit, limit = TakeProfitBuy, when = strategy.position_size > 0)

// Short Position
if isSell and timeRange
    strategy.entry("Short", strategy.short, stop = SellEnter, when = strategy.position_size == 0)

strategy.exit("Short Exit", "Short", stop=SellExit, limit = TakeProfitSell, when = strategy.position_size < 0)

// Close & Cancel when over End of the Test
if time > endTest
    strategy.close_all()
    strategy.cancel_all()