시장 롱 및 숏 포스에 기반한 이치모쿠 클라우드 브레이크아웃 전략

개요
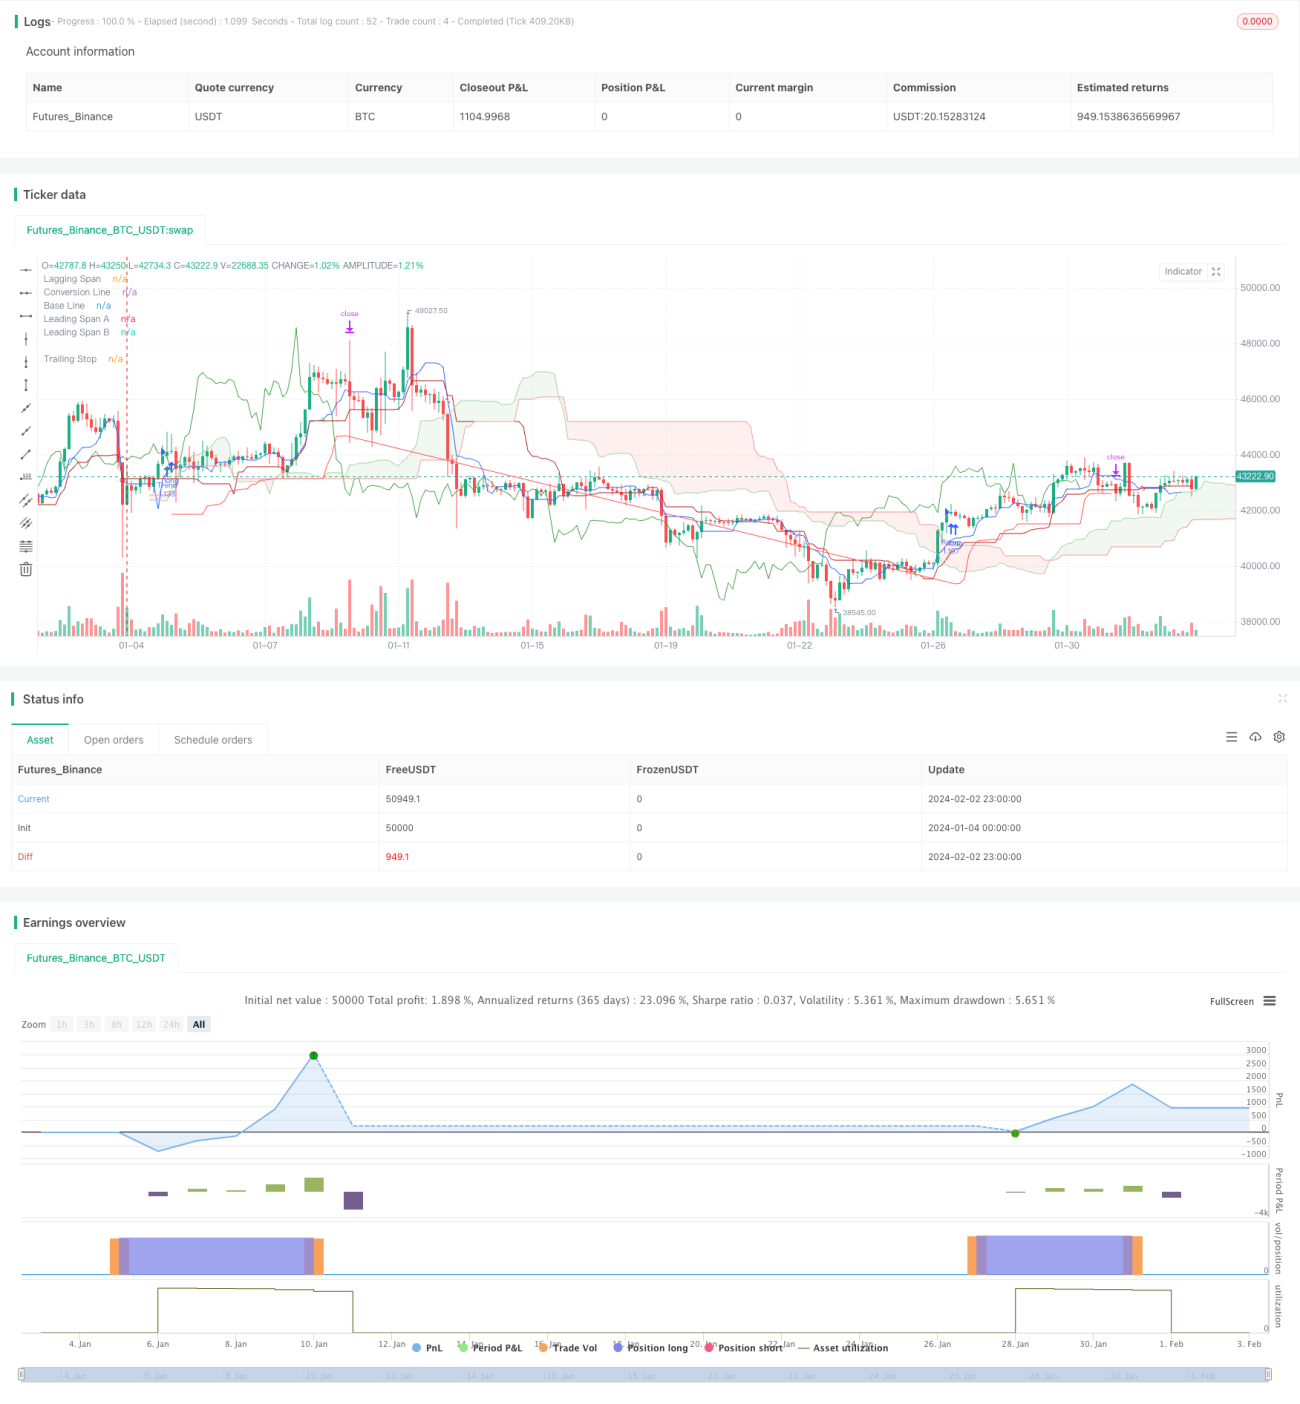
이 전략은 트렌드 추적 전략이며, 이치모쿠 클라우드 지표의 구성과 결합하여 시장의 다중적인 힘을 판단하여 잠재적인 돌파 기회를 발견한다. 핵심 구성 요소는 이치모쿠 클라우드 기반의 판단 프레임워크, ATR 중지, 비율 중지 및 선택적인 중지 메커니즘을 포함한다.
전략 원칙
전략의 핵심 판단은 두 부분으로 이루어져 있는데, 하나는 이치모쿠 클라우드 지표에 기반한 시장의 공백력 판단의 트렌드 신호이며, 하나는 잠재적인 돌파구에 기반한 강도 신호이다.
트렌드 판단을 위해, 동시에 Conversion Line 상에서 Base Line를 통과하는 것은 다단 트렌드가 구축되었다는 것을 나타냅니다. Lagging Span은 K선 엔티티가 현재 다단 힘이 강하다는 것을 나타냅니다.
강력한 신호의 경우, 동시에 클라우드에서 최저 최고 가격보다 높은 가격이 초강력 표시, 변환 라인과 베이스 라인이 다중으로 표시되는 전력 충전 등의 조건을 충족시켜야 한다.
두 종류의 조건의 임의의 세트가 촉발되면, 시장 가격 단위로 더 많은 포지션을 열 수 있습니다. 그 후 ATR, 퍼센트 또는 Ichimoku 클라우드 지표의 규칙에 따라 스톱 로스 추적을 설정하여 수익을 더 잠금화 할 수 있습니다.
우위 분석
이 전략의 가장 큰 장점은 이치모쿠 클라우드의 트렌드 판단과 다중 공간 힘 평가 기능을 동시에 활용한다는 것입니다. 단일 이동 평균과 같은 지표에 비해 이치모쿠 클라우드는 현재 상황에 대한 힘 대조를 더 잘 반영하여 신호의 정확성을 향상시킵니다.
또한, ATR과 Stop Loss Percentage을 결합하여 위험을 관리하여 단독 손실을 잘 제어 할 수 있습니다. 또한, 선택 가능한 스톱 메커니즘은 전략 수익을 더 안정적으로 만듭니다.
위험 분석
이 전략의 주요 위험은 이치모쿠 구름 자체에 약간의 지연성이 있다는 것이다. 또한, 강력한 신호가 추적의 특성으로서, 전략이 잡히는 가능성을 증가시킬 수도 있다.
지연 문제로 인한 위험을 줄이기 위해, 이치모쿠 구름의 파라미터 사이클을 적절히 단축할 수 있다. 강한 신호로 인한 위험에 대해서는, 손해 추적을 위한 설정을 강화할 필요가 있다.
최적화 방향
이 전략은 다음과 같은 방향으로 더 개선될 수 있습니다.
-
다양한 시장의 데이터를 테스트하여 전략의 강도와 적응성을 판단합니다.
-
이치모쿠 클라우드의 매개 변수를 최적화하여 특정 시장 상황에 맞게 조정
-
파격 신호의 강도를 판단하는 데 도움이 되는 LSTM와 같은 딥러닝 알고리즘을 시도합니다.
-
에너지 수치를 추가하여 추락의 확률을 피할 수 있습니다.
요약하다
이 전략은 이치모쿠 클라우드의 구성 판단 시장의 여공 힘을 활용하고, 잠재적인 트렌드를 포착하는 동시에, 위험 관리를 충분히 고려한다. 이 전략은 수익성과 통제가능성을 효과적으로 균형을 맞추고 있다.
/*backtest
start: 2024-01-04 00:00:00
end: 2024-02-03 00:00:00
period: 3h
basePeriod: 15m
exchanges: [{"eid":"Futures_Binance","currency":"BTC_USDT"}]
*/

// This source code is subject to the terms of the Mozilla Public License 2.0 at https://mozilla.org/MPL/2.0/
// © mikul_se
//@version=5
strategy("mikul's Ichimoku Cloud Strategy v 2.0", shorttitle="mikul's Ichi strat", overlay=true, margin_long=100, margin_short=100, default_qty_type = strategy.percent_of_equity, default_qty_value = 100)- 1