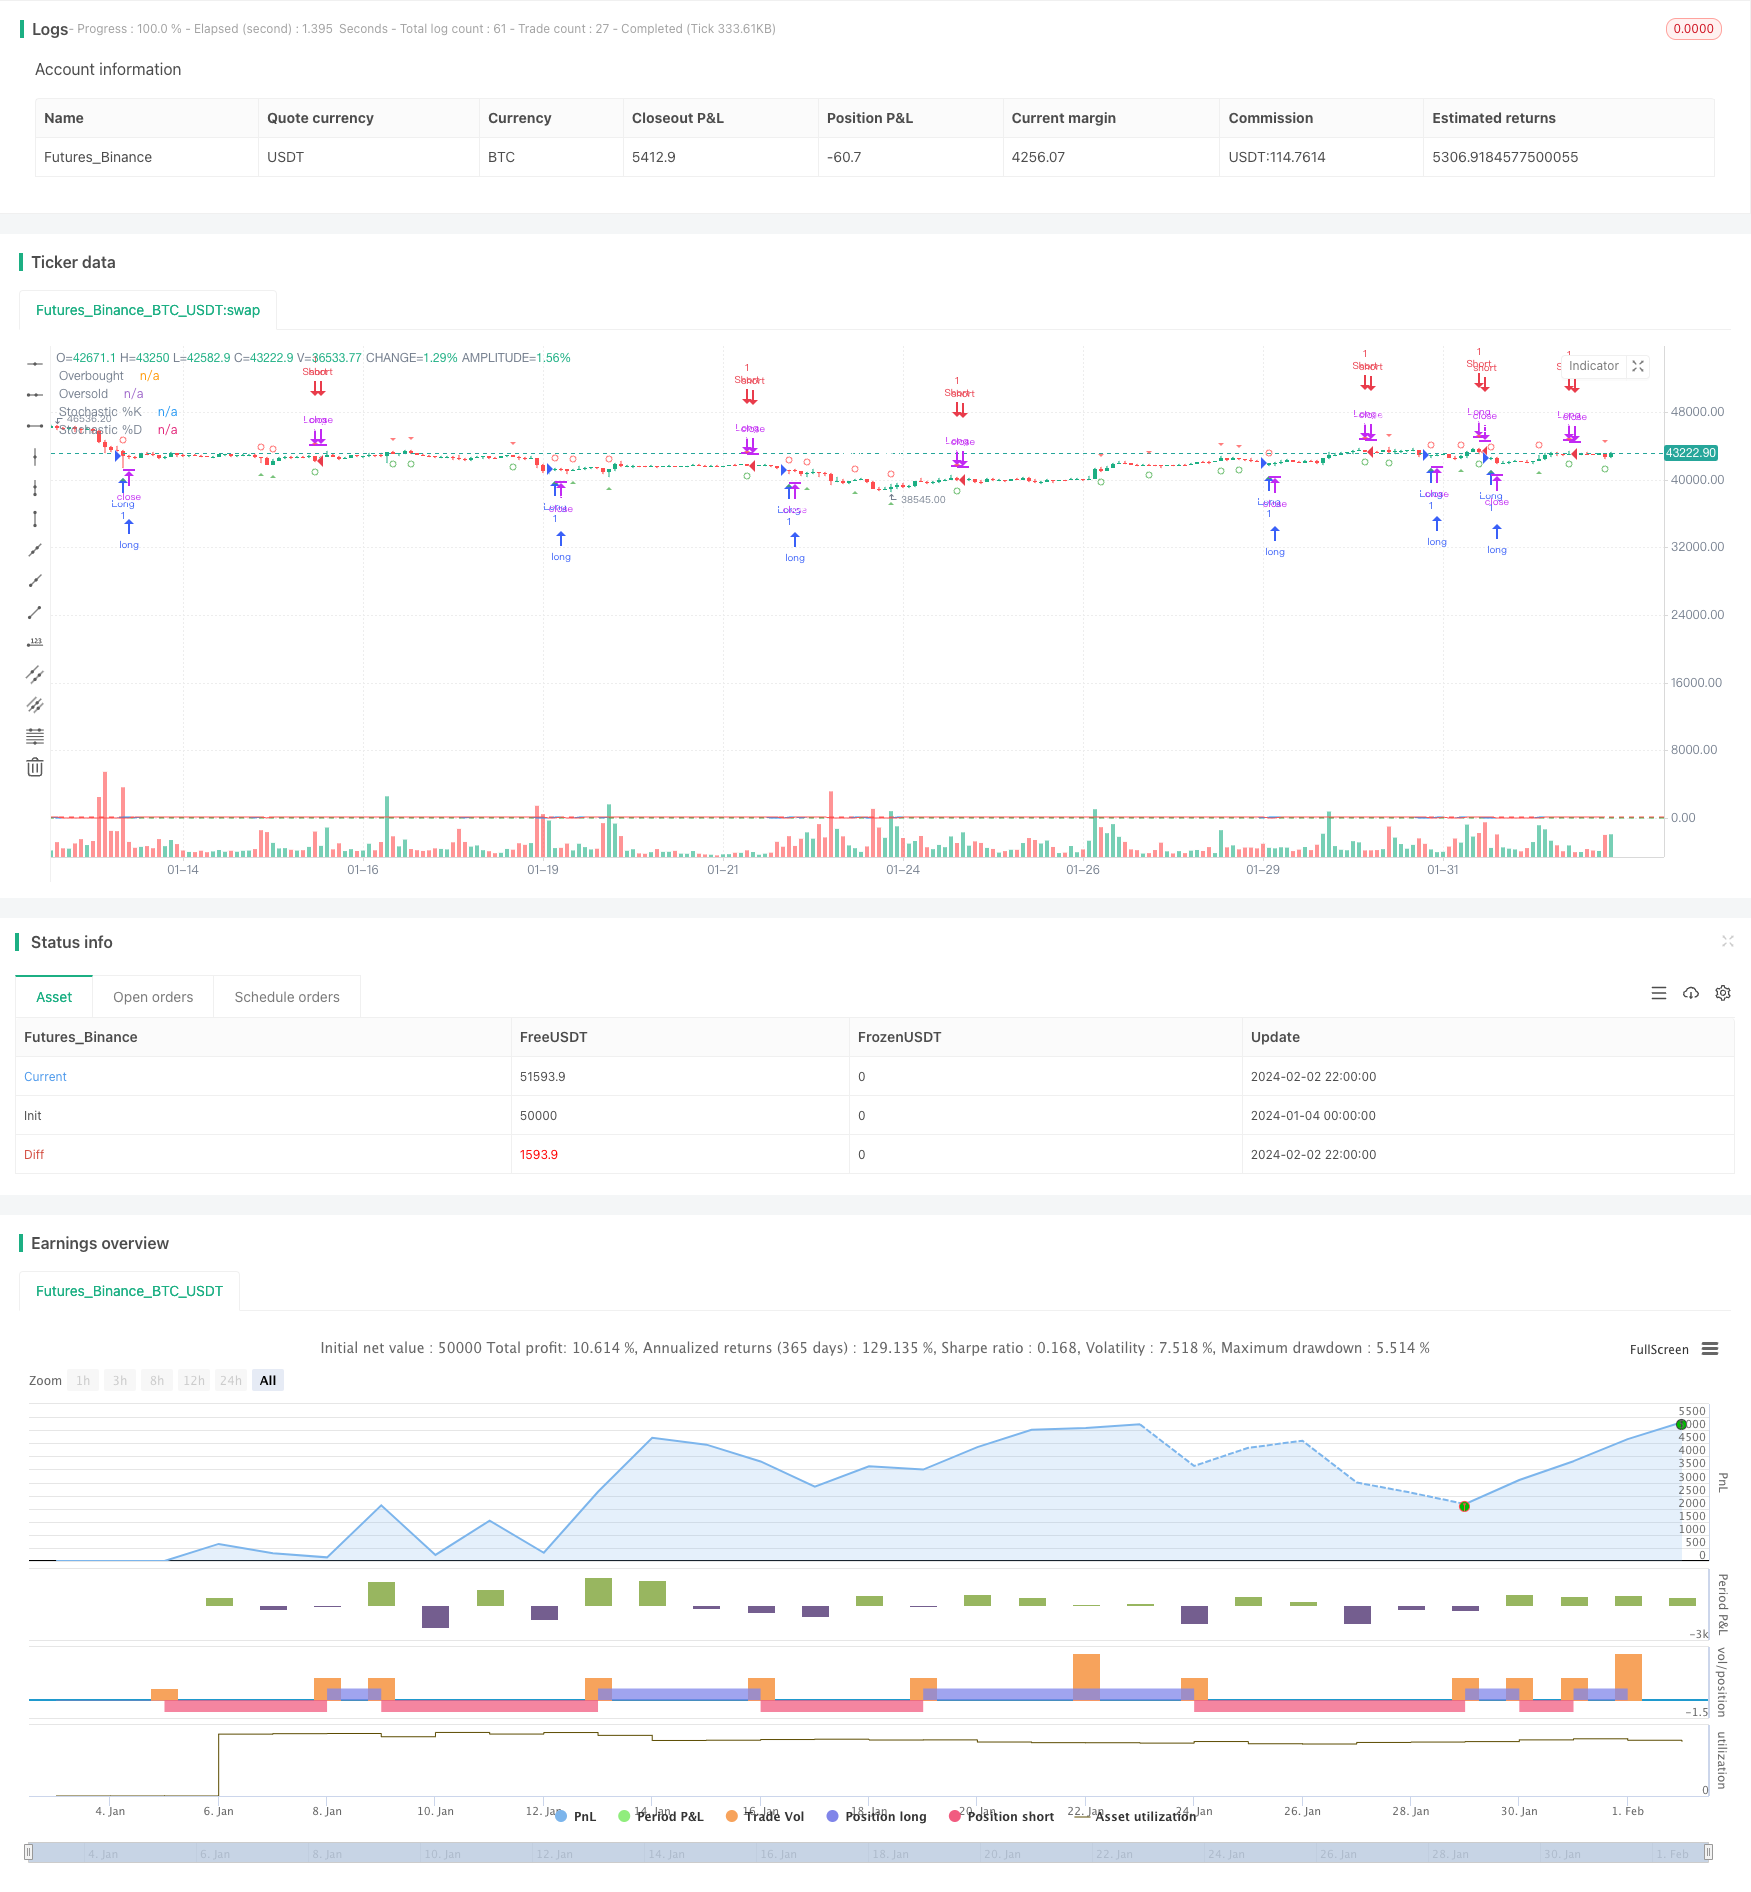
개요
이 전략은 스토카스틱 지표에 기반한 주기적 옵션 거래 전략으로, 스토카스틱 흔들림 지표를 사용하여 옵션 거래의 잠재적인 입시 및 퇴출 지점을 식별합니다. 이 전략은 옵션 거래에 특화되어 있으며, 다공간의 양쪽 끝에서 거래 기회를 식별 할 수 있습니다.
전략 원칙
이 전략은 14주기 스토카스틱 %K 라인과 3주기 간단한 이동 평균을 사용하여 스토카스틱 %D 라인을 그리는 것이다. %K 라인이 낮은 곳에서%D 라인을 돌파할 때 호불호 신호로 간주한다. %K 라인이 높은 곳에서%D 라인을 돌파할 때 호불호 신호로 간주한다. 구체적인 입점 및 퇴출 조건은 다음과 같다:
다중 입점: %K 라인이 20 이하의 레벨에서 %D 라인을 뚫을 때 더 많이 한다 다중 헤드 탈퇴: %K 라인이 80% 이상의 레벨에서 %D 라인을 깨면 평점 공허 입구: %K 라인이 80 이상 레벨에서 %D 라인을 깨면 공허 빈 머리 탈퇴: %K 라인이 20 이하의 레벨에서 %D 라인을 돌파할 때 평점
전략적 이점
- 스토카스틱 지표를 사용하여 과매매 지역을 식별하고 상위에서 더 많은 하위 하위 하위 하위 하위 하락을 피하십시오.
- 지표 변수 최적화와 결합하여 거래 신호 품질을 향상시킵니다.
- 사용자 정의 입출장 조건, 포지션 관리 최적화
- 선택권 거래에 사용할 수 있으며, 자금 사용 효율을 높일 수 있습니다.
위험 분석
- 스토카스틱 지표는 가짜 신호를 발생하기 쉽고, 다른 지표와 함께 필터링을 해야 합니다.
- 고정 변수 설정으로 일부 거래 기회를 놓칠 수 있습니다.
- 철회 규모가 확대될 수 있으며, 단일 포지션 규모를 통제해야 한다.
- 주식 기본 사항과 거시 환경 변화에 주의해야 합니다.
전략 최적화 방향
- 이동 평균과 같은 지표들이 가짜 신호를 필터링합니다.
- 다양한 변수 조합을 테스트하고 변수 설정을 최적화합니다.
- 파격 변수를 높여서 가짜 신호를 줄여라
- 단위 손실을 제어하기 위한 절감 조건 최적화
요약하다
이 전략은 Stochastic 지표의 오버 바이 오버 셀 원칙을 사용하여 잠재적인 진입 시점을 식별한다. 전통적인 트렌드 추적 전략에 비해 시장의 전환점에 큰 시장을 포착할 수 있다. 변수 최적화, 신호 필터링 등의 수단으로 전략의 안정성을 더욱 향상시킬 수 있다. 이 전략은 옵션 거래에 사용할 수 있으며, 위험을 통제하는 조건에서 높은 수익을 얻을 수 있다.
전략 소스 코드
/*backtest
start: 2024-01-04 00:00:00
end: 2024-02-03 00:00:00
period: 2h
basePeriod: 15m
exchanges: [{"eid":"Futures_Binance","currency":"BTC_USDT"}]
*/

//@version=5
strategy("Stochastic Weekly Options Strategy", overlay=true, shorttitle="WOS")

// Stochastic settings
K = ta.stoch(close, high, low, 14)
D = ta.sma(K, 3)

// Entry and exit conditions
longEntry = ta.crossover(K, 20)
longExit = ta.crossunder(K, 80)

shortEntry = ta.crossunder(K, 80)
shortExit = ta.crossover(K, 20)

// Strategy execution
strategy.entry("Long", strategy.long, when=longEntry)
strategy.close("Long", when=longExit)

strategy.entry("Short", strategy.short, when=shortEntry)
strategy.close("Short", when=shortExit)

// Alert conditions
alertcondition(longEntry, title="Long Entry Alert", message="Stochastic bullish crossover! Consider buying a call option.")
alertcondition(longExit, title="Long Exit Alert", message="Stochastic bearish crossover! Consider selling the call option.")
alertcondition(shortEntry, title="Short Entry Alert", message="Stochastic bearish crossover! Consider buying a put option.")
alertcondition(shortExit, title="Short Exit Alert", message="Stochastic bullish crossover! Consider selling the put option.")

// Plotting shapes for buy and sell signals
plotshape(longEntry, title="Calls Entry Label", color=color.new(color.green, 25),
     textcolor=color.white, style=shape.triangleup, text="Calls", location=location.belowbar, size=size.small)

plotshape(longExit, title="Calls Exit Label", color=color.new(color.green, 25),
     textcolor=color.white, style=shape.circle, text="Exit", location=location.belowbar, size=size.small)

plotshape(shortEntry, title="Puts Entry Label", color=color.new(color.red, 25),
     textcolor=color.white, style=shape.triangledown, text="Puts", location=location.abovebar, size=size.small)

plotshape(shortExit, title="Puts Exit Label", color=color.new(color.red, 25),
     textcolor=color.white, style=shape.circle, text="Exit", location=location.abovebar, size=size.small)

// Plotting
plot(K, color=color.blue, title="Stochastic %K")
plot(D, color=color.red, title="Stochastic %D")
hline(80, "Overbought", color=color.red)
hline(20, "Oversold", color=color.green)