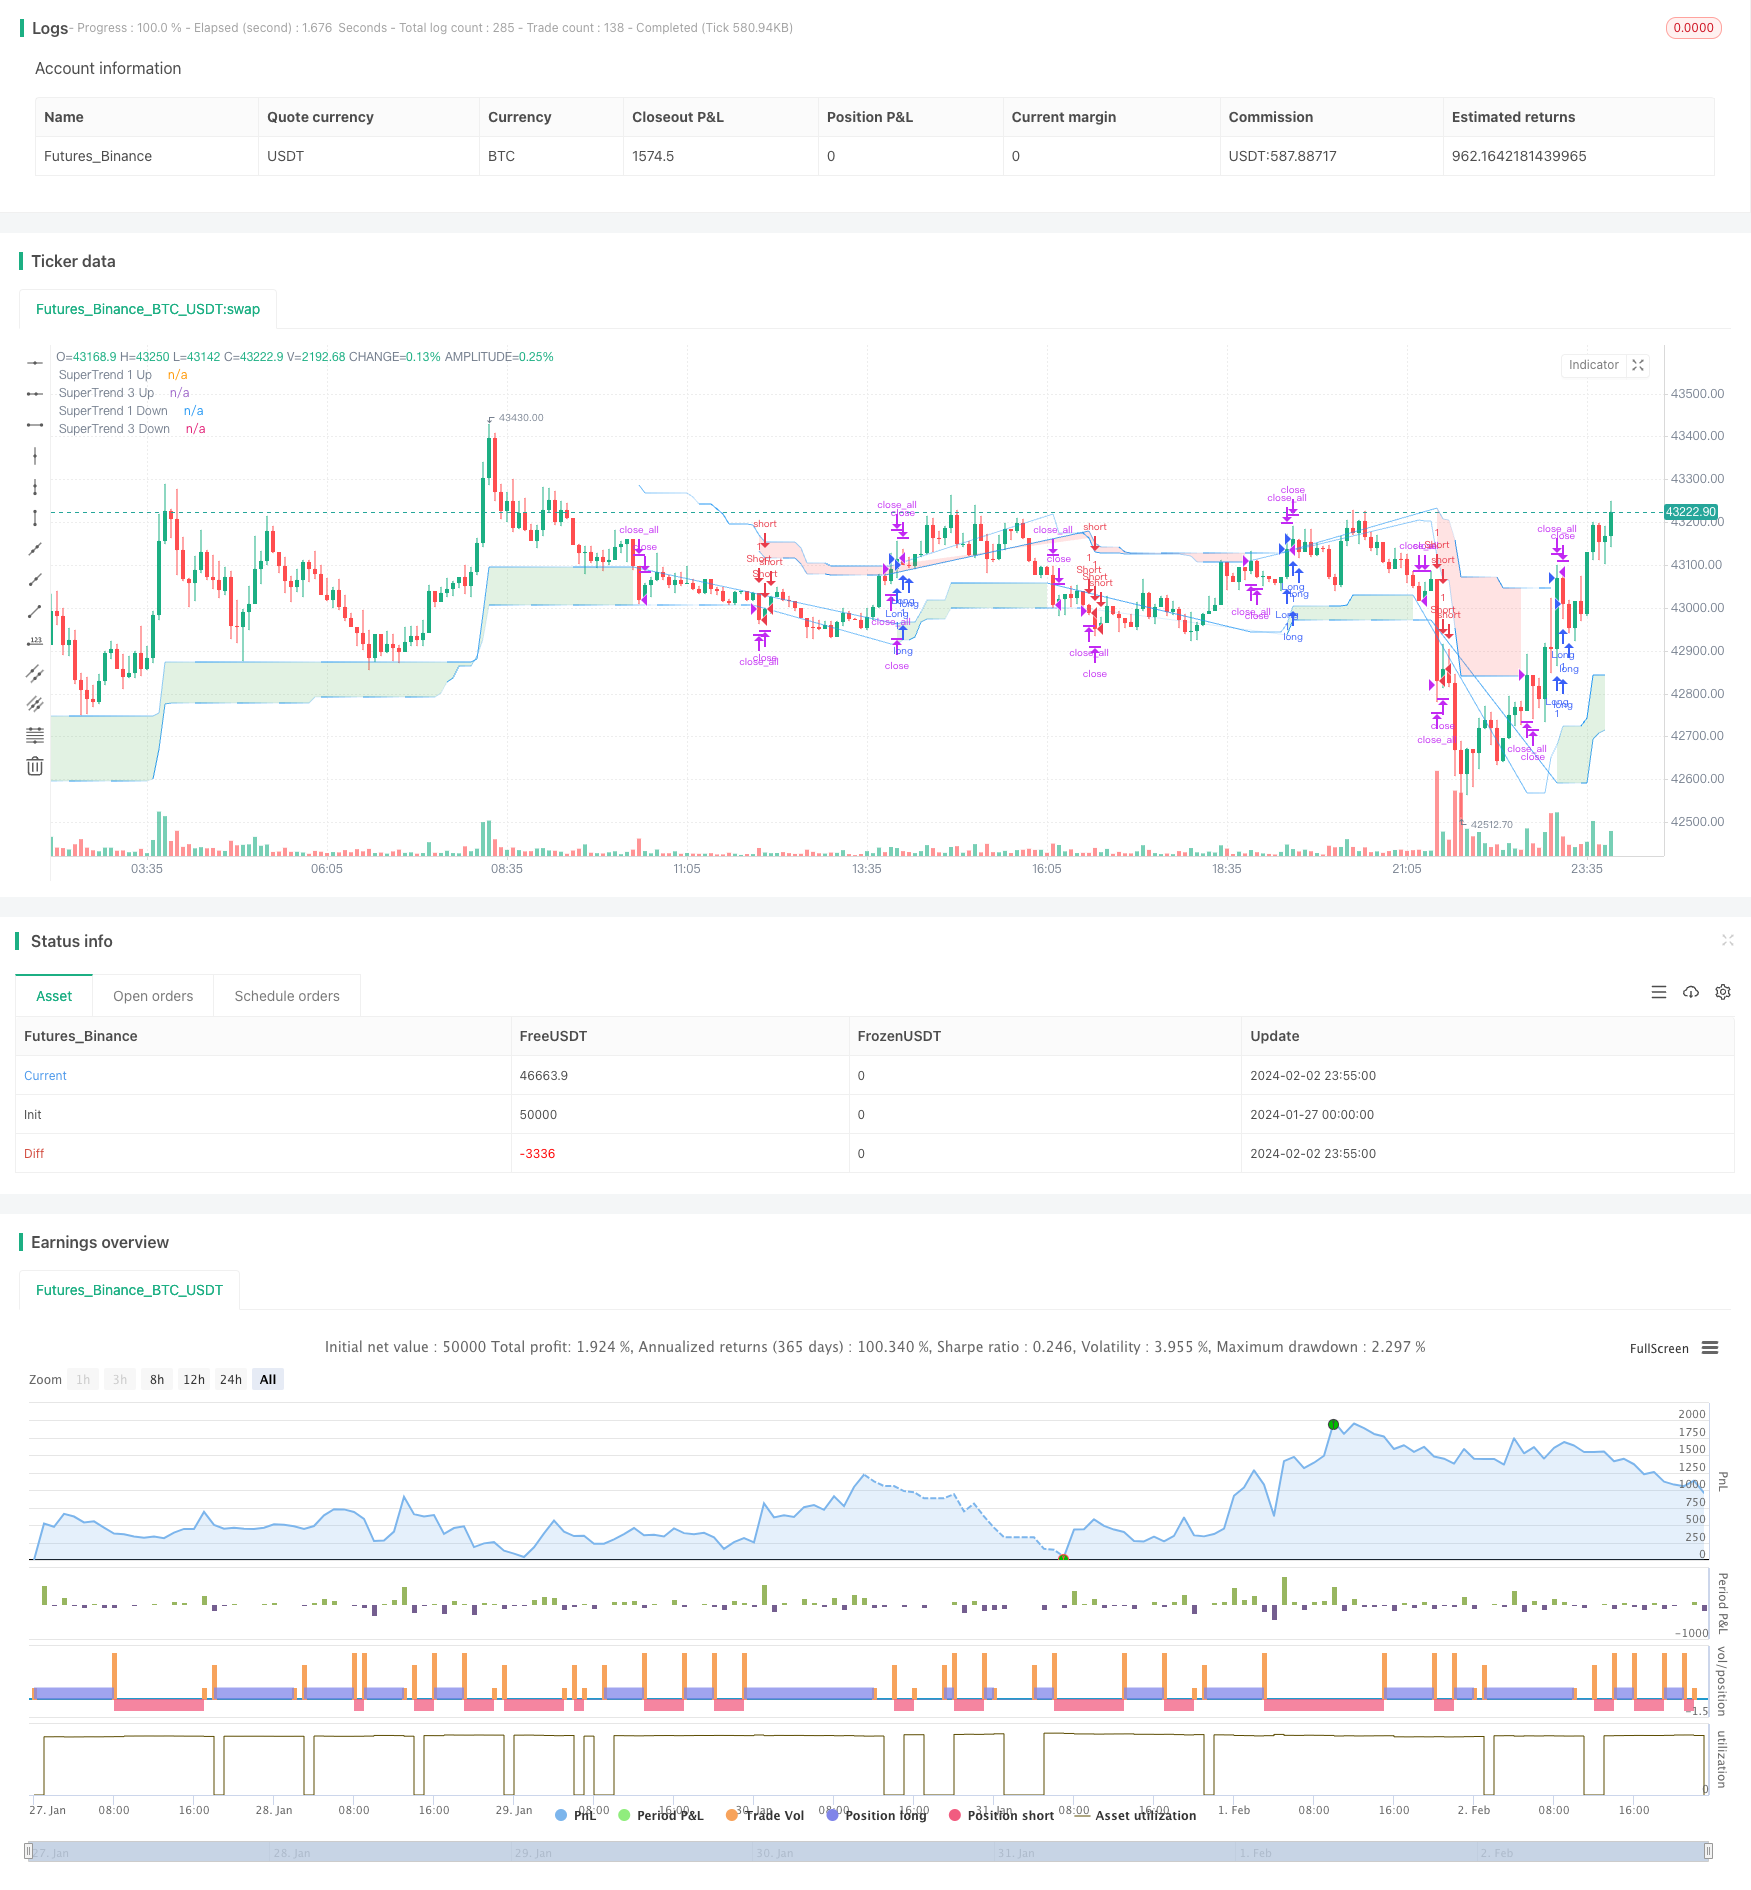
개요
이 전략은 초 트렌드 지표와 엘리엇 파동 이론을 결합하여 안정적인 기술 거래 도구를 구축합니다. 그것은 여러 계층의 트렌드 분석을 사용하여 더 포괄적인 시장 관점을 제공하며, 시장의 잠재적인 트렌드 반전과 중요한 가격 변화를 초기 캡처 할 수 있습니다.
전략 원칙
이 프로젝트의 핵심 아이디어는 다음과 같은 다단계적인 접근법입니다.
- 4개의 초진동적 지표가 사용되며, 각각의 지표는 다른 ATR 길이와 배수를 사용하여 단기부터 장기까지의 추세를 판단합니다.
- 지표의 결합을 통해, 튼튼한 더 많은 것을 하고 더 많은 것을 하지 않는 신호를 찾을 수 있습니다.
- 엘리엇 파동의 패턴 인식 방법을 참조하여 비슷한 시장 행동 패턴을 식별하고 거래 신호를 확인합니다.
이 방법은 여러 지표들을 이용하는 것뿐만 아니라 패턴 식별을 추가하여 전략을 더욱 안정화시킵니다.
우위 분석
- 다중 지표 설계, 전체적인 판단
- 파동이론에 영감을 받아 패턴 인식이 안정성을 증가시킵니다.
- 실시간으로 방향을 조정하고 시장 변화에 적응합니다.
- 다양한 품종과 시간 주기에서 사용할 수 있는 파라미터를 구성할 수 있습니다
위험 분석
- 변수 설정은 경험에 의존하고, 최적의 변수 조합을 결정하기 위해 조정할 필요가 있다.
- 다중 지표 설계가 더 복잡하여 계산 부하가 증가
- 잘못된 신호를 완전히 피할 수 없습니다.
매개 변수 최적화를 통해 최적의 매개 변수를 점진적으로 결정할 수 있다. 클라우드 컴퓨팅을 도입하여 컴퓨팅 성능을 향상시킬 수 있다. 위험을 제어하기 위해 스톱 로스를 설정할 수 있다.
최적화 방향
다음의 몇 가지 측면에서 최적화할 수 있습니다.
- 시장 상황에 따라 동적으로 변수를 조정하는 적응 변수 조정 모듈을 추가합니다.
- 거래 신호의 신뢰성을 판단하는 데 도움이 되는 기계 학습 모델을 추가합니다.
- 감정 지표, 뉴스 사건과 같은 외부 요소와 결합하여 시장 패턴을 판단합니다.
- 다중 품종 파라미터 템플릿을 지원하여 테스트 작업량을 줄입니다.
이것은 전략적 매개 변수를 더 지능화하고, 판단을 더 정확하게 하고, 실제 적용을 더 편리하게 할 것입니다.
요약하다
이 전략 종합은 추세와 모형의 두 가지 차원을 고려하여 판단의 안정성을 보장하고 전략의 유연성을 증가시킵니다. 다중 지표와 매개 변수 설정은 전체 시장 적용성을 보장합니다. 지능화 및 자동화 방법을 추가로 도입하면 전략의 실전 수준을 크게 향상시킬 수 있습니다. 기술 거래의 발전에 유익한 영감을 제공하고 참고합니다.
전략 소스 코드
/*backtest
start: 2024-01-27 00:00:00
end: 2024-02-03 00:00:00
period: 5m
basePeriod: 1m
exchanges: [{"eid":"Futures_Binance","currency":"BTC_USDT"}]
*/

//@version=5
strategy("Elliott's Quadratic Momentum - Strategy [presentTrading]",shorttitle = "EQM Strategy [presentTrading]", overlay=true )

// Inputs for selecting trading direction
tradingDirection = input.string("Both", "Select Trading Direction", options=["Long", "Short", "Both"])


// SuperTrend Function
supertrend(src, atrLength, multiplier) =>
    atr = ta.atr(atrLength)
    up = hl2 - (multiplier * atr)
    dn = hl2 + (multiplier * atr)
    trend = 1
    trend := nz(trend[1], 1)
    up := src > nz(up[1], 0) and src[1] > nz(up[1], 0) ?   math.max(up, nz(up[1], 0)) : up
    dn := src < nz(dn[1], 0) and src[1] < nz(dn[1], 0) ? math.min(dn, nz(dn[1], 0)) : dn
    trend := src > nz(dn[1], 0) ?  1 : src < nz(up[1], 0)? -1 : nz(trend[1], 1)
    [up, dn, trend]

// Inputs for SuperTrend settings
atrLength1 = input(7, title="ATR Length for SuperTrend 1")
multiplier1 = input(4.0, title="Multiplier for SuperTrend 1")
atrLength2 = input(14, title="ATR Length for SuperTrend 2")
multiplier2 = input(3.618, title="Multiplier for SuperTrend 2")
atrLength3 = input(21, title="ATR Length for SuperTrend 3")
multiplier3 = input(3.5, title="Multiplier for SuperTrend 3")
atrLength4 = input(28, title="ATR Length for SuperTrend 3")
multiplier4 = input(3.382, title="Multiplier for SuperTrend 3")

// Calculate SuperTrend
[up1, dn1, trend1] = supertrend(close, atrLength1, multiplier1)
[up2, dn2, trend2] = supertrend(close, atrLength2, multiplier2)
[up3, dn3, trend3] = supertrend(close, atrLength3, multiplier3)
[up4, dn4, trend4] = supertrend(close, atrLength4, multiplier4)


// Entry Conditions based on SuperTrend and Elliott Wave-like patterns
longCondition = trend1 == 1 and trend2 == 1 and trend3 == 1 and trend4 == 1
shortCondition = trend1 == -1 and trend2 == -1 and trend3 == -1 and trend4 == - 1

// Strategy Entry logic based on selected trading direction
if tradingDirection == "Long" or tradingDirection == "Both"
    if longCondition
        strategy.entry("Long", strategy.long)
        // [Any additional logic for long entry]

if tradingDirection == "Short" or tradingDirection == "Both"
    if shortCondition
        strategy.entry("Short", strategy.short)
        // [Any additional logic for short entry]


// Exit conditions - Define your own exit strategy
// Example: Exit when any SuperTrend flips
if trend1 != trend1[1] or trend2 != trend2[1] or trend3 != trend3[1] or trend4 != trend4[1]
    strategy.close_all()

// Function to apply gradient effect
gradientColor(baseColor, length, currentBar) =>
    var color res = color.new(baseColor, 100)
    if currentBar <= length
        res := color.new(baseColor, int(100 * currentBar / length))
    res

// Apply gradient effect
color1 = gradientColor(color.blue, atrLength1, bar_index % atrLength1)
color4 = gradientColor(color.blue, atrLength4, bar_index % atrLength3)


// Plot SuperTrend with gradient for upward trend
plot1Up = plot(trend1 == 1 ? up1 : na, color=color1, linewidth=1, title="SuperTrend 1 Up")
plot4Up = plot(trend4 == 1 ? up4 : na, color=color4, linewidth=1, title="SuperTrend 3 Up")

// Plot SuperTrend with gradient for downward trend
plot1Down = plot(trend1 == -1 ? dn1 : na, color=color1, linewidth=1, title="SuperTrend 1 Down")
plot4Down = plot(trend4 == -1 ? dn4 : na, color=color4, linewidth=1, title="SuperTrend 3 Down")

// Filling the area between the first and third SuperTrend lines for upward trend
fill(plot1Up, plot4Up, color=color.new(color.green, 80), title="SuperTrend Upward Band")

// Filling the area between the first and third SuperTrend lines for downward trend
fill(plot1Down, plot4Down, color=color.new(color.red, 80), title="SuperTrend Downward Band")