개요
이중 범위 필터 트렌드 추적 전략 (Dual Range Filter Trend Tracking Strategy) 은 양 EMA 범위 필터를 사용하여 트렌드 방향을 식별하고 트렌드를 추적하는 양적 거래 전략이다. 이 전략은 양평선 필터링과 ATR 범위 계산을 결합하여 중장선 트렌드 방향을 효과적으로 식별하고 트렌드 중지 추적을 사용하여 수익을 고정시킬 수 있습니다.
전략 원칙
이 전략의 핵심은 이중 EMA 범위를 필터링하는 것입니다. 그것은 K 선의 ATR 범위를 계산하고 평형화한 다음 두 개의 EMA를 결합하여 K 선의 범위에 위치하여 현재 트렌드에 있는지 판단합니다. 가격이 범위를 돌파하면 트렌드가 변하는 것을 나타냅니다.
구체적으로, 전략은 먼저 K 선의 ATR 범위의 크기를 계산하고, 두 개의 EMA를 결합하여 평형합니다. ATR 범위는 K 선의 정상적인 변동 범위를 나타냅니다. 가격이 이 범위를 초과하면 트렌드 변화가 있음을 의미합니다. 전략은 가격이 EMA 범위를 돌파하는 방향을 기록합니다. 방향이 바뀌면 트렌드 전환을 나타냅니다.
진입 후, 전략은 부동의 손실을 사용하여 이익을 잠금합니다. 포지션 기간 동안, K 라인이 범위를 초과한지 아닌지를 실시간으로 판단하고, 만약 반전이 발생하면 현재 지위를 탈퇴합니다. 이것은 트렌드 거래의 이익을 효과적으로 잠금 할 수 있습니다.
우위 분석
이중 범위 필터링 트렌드 추적 전략은 평선 필터링과 범위 계산의 장점을 결합하여 트렌드의 방향을 정확하게 판단하고, 흔들리는 상황에서 자주 출전하는 것을 피할 수 있습니다. 구체적인 장점은 다음과 같습니다:
- ATR 원리를 사용하여 K선 변동 범위를 판단하여 흔들리는 시장에서 방향없는 진입을 피하십시오.
- 이중 EMA 필터링은 판단 정확도를 높이고 가짜 신호를 감소시킵니다.
- 실시간 플로잉 스톱으로 트렌드 수익을 효과적으로 고정할 수 있습니다.
- 전략 논리는 간단하고 명확하며, 이해하기 쉽고 최적화됩니다.
위험 분석
이 전략에는 다음과 같은 몇 가지 측면에 초점을 맞춘 몇 가지 위험도 있습니다.
- ATR 범위를 돌파하는 큰 폭의 폭파는 조기 입장을 초래합니다.
- 강세를 보인 시점에서는 조기 중단이 발생할 수 있습니다.
- 변수 설정이 잘못되면 정책 성능에도 영향을 미칠 수 있습니다.
이러한 위험은 적절한 최적화 파라미터, 가짜 브레이크 방지, 트렌드 강도를 판단하는 방법과 같은 방법으로 해결할 수 있습니다.
최적화 제안
이중 범위를 필터링하는 트렌드 추적 전략은 또한 더 많은 최적화 가능성이 있습니다. 주요 최적화 방향은 다음과 같습니다.
- ATR 파라미터를 최적화하여 K선 변동 범위를 평평하게 한다.
- 거래량 지표와 함께 가짜 돌파구를 피하십시오.
- 동향의 강도를 판단하고, 단발적 동향과 지속가능한 동향을 구분한다.
- 스톱포인트 최적화, 수익을 보장하는 조건에서 상위 트렌드를 추적
이러한 최적화를 통해 전략은 더 많은 시장 환경에서 안정적인 수익을 얻을 수 있습니다.
요약하다
이중 범위 필터링 트렌드 추적 전략은 평준선 필터링과 ATR 범위 판단의 여러 장점을 통합하여 중장선 지속 트렌드의 방향과 진입 시기를 효과적으로 식별할 수 있습니다. 그것은 트렌드가 변했을 때만 진입하고 부동의 손실을 사용하여 수익을 고정합니다. 이 전략의 논리는 간단하고 명확하며 중장선 트렌드 거래에 적합합니다.
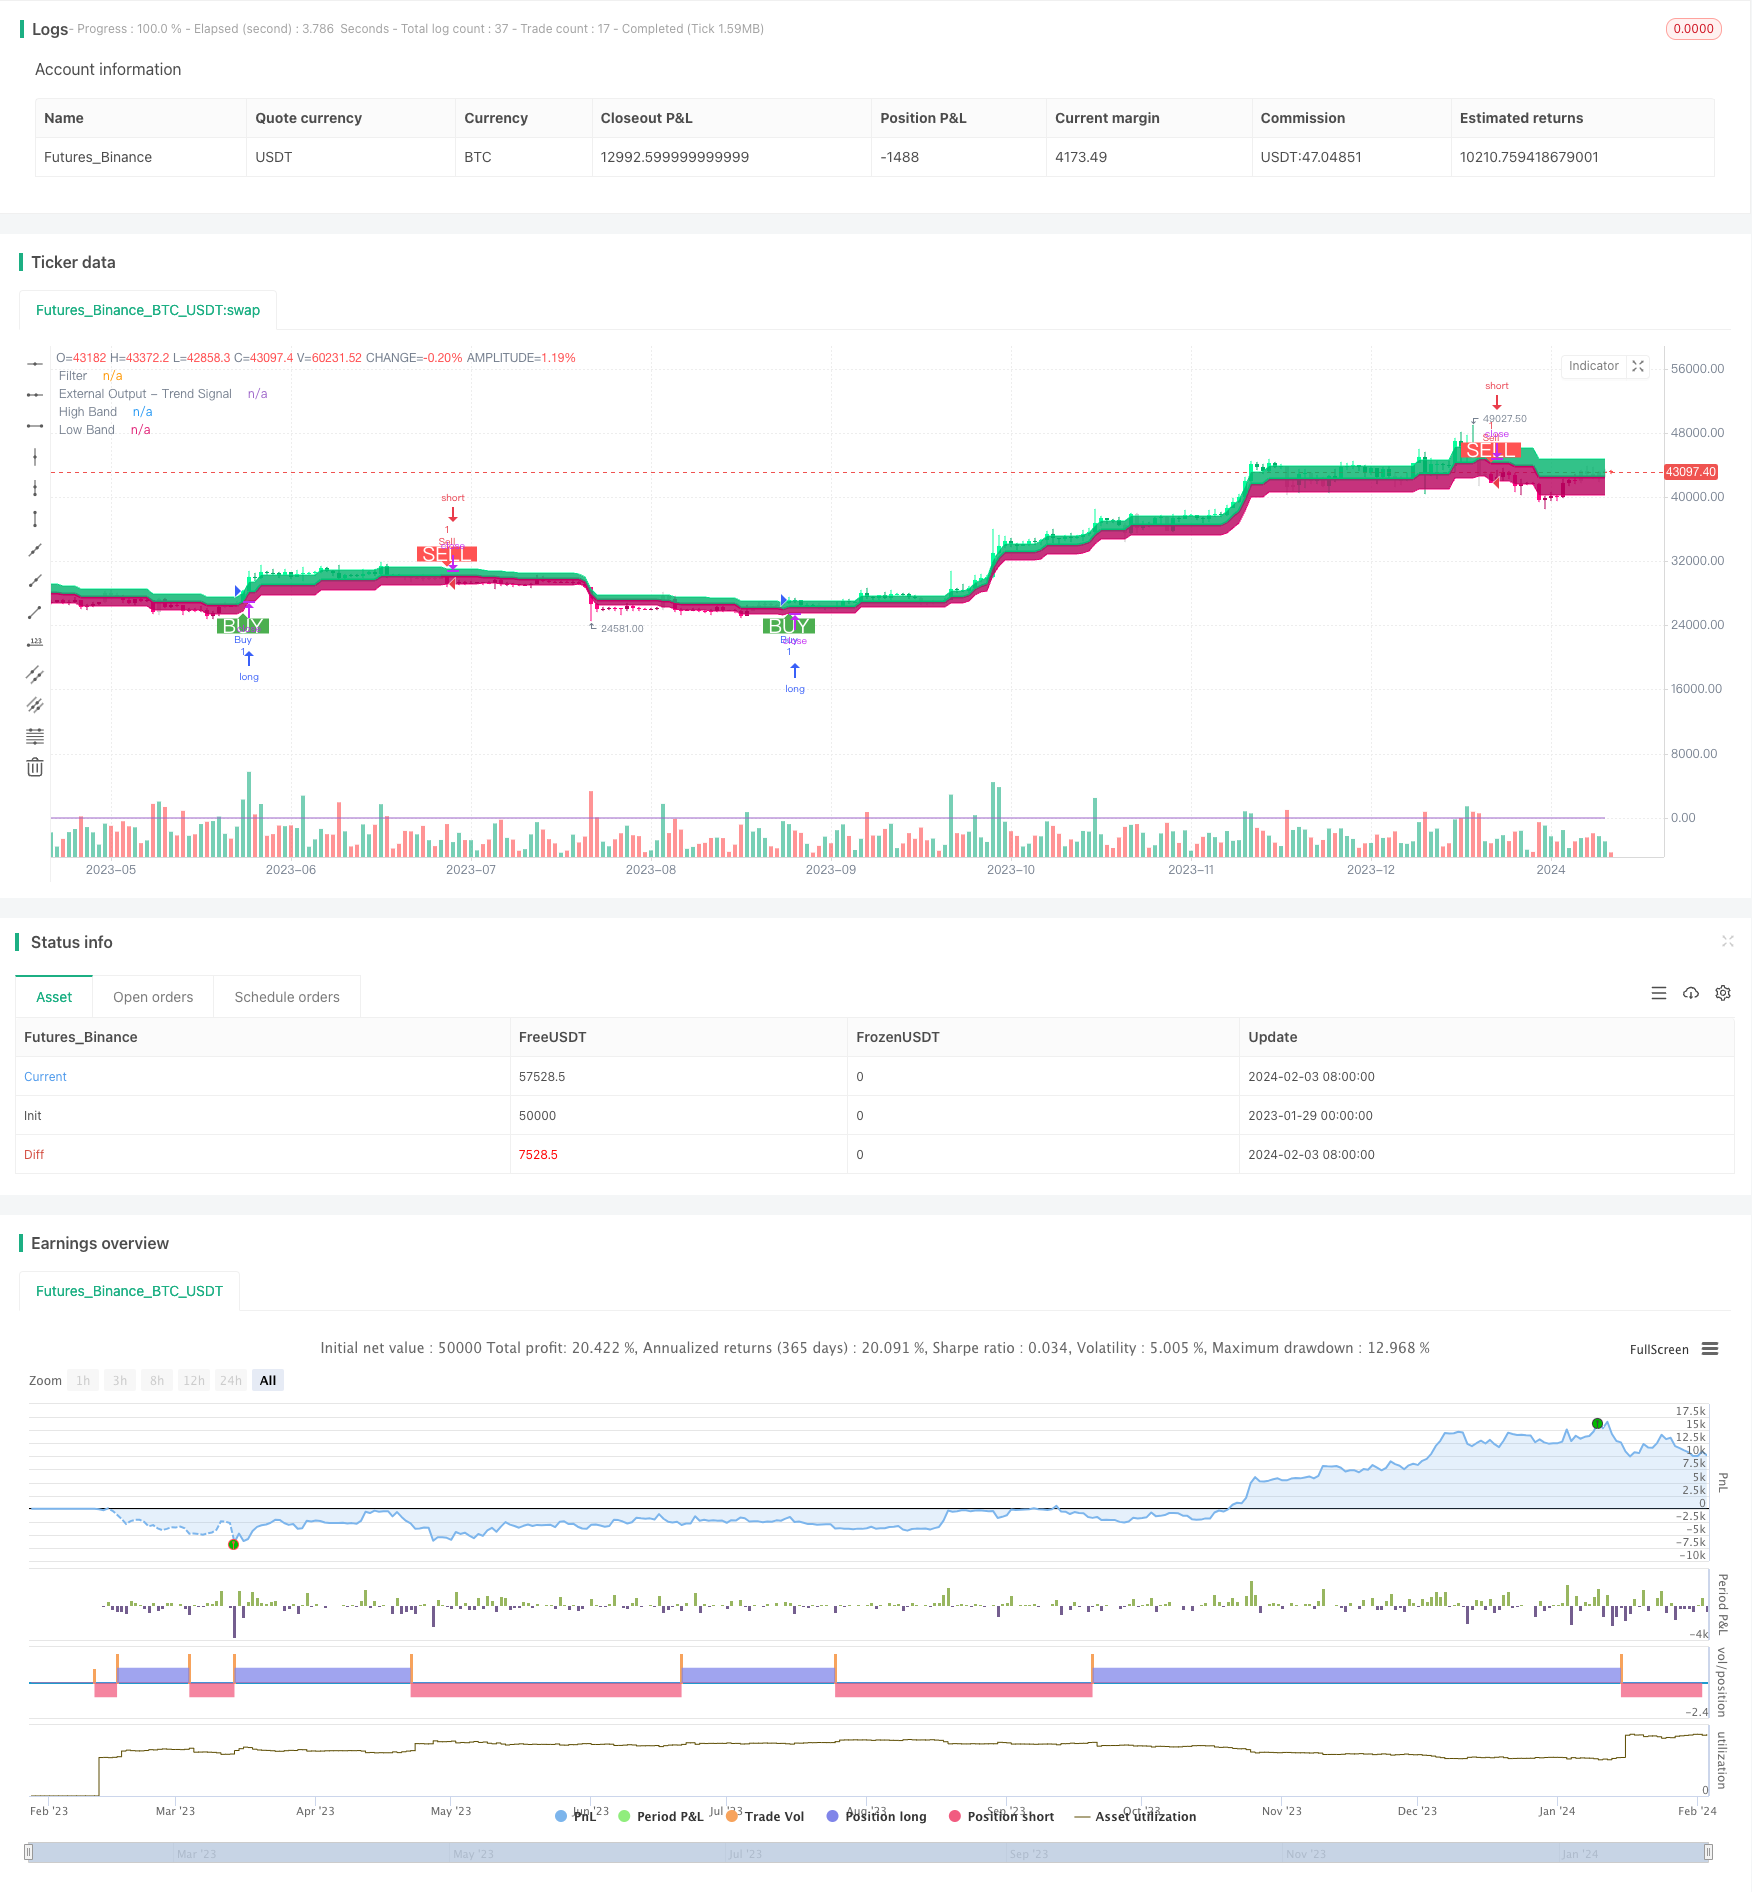
/*backtest
start: 2023-01-29 00:00:00
end: 2024-02-04 00:00:00
period: 1d
basePeriod: 1h
exchanges: [{"eid":"Futures_Binance","currency":"BTC_USDT"}]
*/

//@version=4
strategy("Range Filter [DW] & Labels", shorttitle="RF [DW] & Labels", overlay=true)

//Conditional Sampling EMA Function
Cond_EMA(x, cond, n)=>
    var val     = array.new_float(0)
    var ema_val = array.new_float(1)
    if cond
        array.push(val, x)
        if array.size(val) > 1
            array.remove(val, 0)
        if na(array.get(ema_val, 0))
            array.fill(ema_val, array.get(val, 0))
        array.set(ema_val, 0, (array.get(val, 0) - array.get(ema_val, 0))*(2/(n + 1)) + array.get(ema_val, 0))
    EMA = array.get(ema_val, 0)
    EMA

//Conditional Sampling SMA Function
Cond_SMA(x, cond, n)=>
    var vals = array.new_float(0)
    if cond
        array.push(vals, x)
        if array.size(vals) > n
            array.remove(vals, 0)
    SMA = array.avg(vals)
    SMA

//Standard Deviation Function
Stdev(x, n)=>
    sqrt(Cond_SMA(pow(x, 2), 1, n) - pow(Cond_SMA(x, 1, n), 2))

//Range Size Function
rng_size(x, scale, qty, n)=>
    ATR      = Cond_EMA(tr(true), 1, n)
    AC       = Cond_EMA(abs(x - x[1]), 1, n)
    SD       = Stdev(x, n)
    rng_size = scale=="Pips" ? qty*0.0001 : scale=="Points" ? qty*syminfo.pointvalue : scale=="% of Price" ? close*qty/100 : scale=="ATR" ? qty*ATR :
               scale=="Average Change" ? qty*AC : scale=="Standard Deviation" ? qty*SD : scale=="Ticks" ? qty*syminfo.mintick : qty

//Two Type Range Filter Function
rng_filt(h, l, rng_, n, type, smooth, sn, av_rf, av_n)=>
    rng_smooth = Cond_EMA(rng_, 1, sn)
    r          = smooth ? rng_smooth : rng_
    var rfilt  = array.new_float(2, (h + l)/2)
    array.set(rfilt, 1, array.get(rfilt, 0))
    if type=="Type 1"
        if h - r > array.get(rfilt, 1)
            array.set(rfilt, 0, h - r)
        if l + r < array.get(rfilt, 1)
            array.set(rfilt, 0, l + r)
    if type=="Type 2"
        if h >= array.get(rfilt, 1) + r
            array.set(rfilt, 0, array.get(rfilt, 1) + floor(abs(h - array.get(rfilt, 1))/r)*r)
        if l <= array.get(rfilt, 1) - r
            array.set(rfilt, 0, array.get(rfilt, 1) - floor(abs(l - array.get(rfilt, 1))/r)*r)
    rng_filt1 = array.get(rfilt, 0)
    hi_band1  = rng_filt1 + r
    lo_band1  = rng_filt1 - r
    rng_filt2 = Cond_EMA(rng_filt1, rng_filt1 != rng_filt1[1], av_n)
    hi_band2  = Cond_EMA(hi_band1, rng_filt1 != rng_filt1[1], av_n)
    lo_band2  = Cond_EMA(lo_band1, rng_filt1 != rng_filt1[1], av_n)
    rng_filt  = av_rf ? rng_filt2 : rng_filt1
    hi_band   = av_rf ? hi_band2 : hi_band1
    lo_band   = av_rf ? lo_band2 : lo_band1
    [hi_band, lo_band, rng_filt]

//-----------------------------------------------------------------------------------------------------------------------------------------------------------------
//Inputs
//-----------------------------------------------------------------------------------------------------------------------------------------------------------------

//Filter Type
f_type = input(defval="Type 1", options=["Type 1", "Type 2"], title="Filter Type")

//Movement Source
mov_src = input(defval="Close", options=["Wicks", "Close"], title="Movement Source")

//Range Size Inputs
rng_qty   = input(defval=2.618, minval=0.0000001, title="Range Size")
rng_scale = input(defval="Average Change", options=["Points", "Pips", "Ticks", "% of Price", "ATR", "Average Change", "Standard Deviation", "Absolute"], title="Range Scale")

//Range Period
rng_per = input(defval=14, minval=1, title="Range Period (for ATR, Average Change, and Standard Deviation)")

//Range Smoothing Inputs
smooth_range = input(defval=true, title="Smooth Range")
smooth_per   = input(defval=27, minval=1, title="Smoothing Period")

//Filter Value Averaging Inputs
av_vals    = input(defval=true, title="Average Filter Changes")
av_samples = input(defval=2, minval=1, title="Number Of Changes To Average")

// New inputs for take profit and stop loss
take_profit_percent = input(defval=100.0, minval=0.1, maxval=1000.0, title="Take Profit Percentage", step=0.1)
stop_loss_percent = input(defval=100, minval=0.1, maxval=1000.0, title="Stop Loss Percentage", step=0.1)

//-----------------------------------------------------------------------------------------------------------------------------------------------------------------
//Definitions
//-----------------------------------------------------------------------------------------------------------------------------------------------------------------

//High And Low Values
h_val = mov_src=="Wicks" ? high : close
l_val = mov_src=="Wicks" ? low : close

//Range Filter Values
[h_band, l_band, filt] = rng_filt(h_val, l_val, rng_size((h_val + l_val)/2, rng_scale, rng_qty, rng_per), rng_per, f_type, smooth_range, smooth_per, av_vals, av_samples)

//Direction Conditions
var fdir = 0.0
fdir    := filt > filt[1] ? 1 : filt < filt[1] ? -1 : fdir
upward   = fdir==1 ? 1 : 0
downward = fdir==-1 ? 1 : 0

//Colors
filt_color = upward ? #05ff9b : downward ? #ff0583 : #cccccc
bar_color  = upward and (close > filt) ? (close > close[1] ? #05ff9b : #00b36b) :
             downward and (close < filt) ? (close < close[1] ? #ff0583 : #b8005d) : #cccccc

//-----------------------------------------------------------------------------------------------------------------------------------------------------------------
//Outputs
//-----------------------------------------------------------------------------------------------------------------------------------------------------------------

//Filter Plot
filt_plot = plot(filt, color=filt_color, transp=0, linewidth=3,  title="Filter")

//Band Plots
h_band_plot = plot(h_band, color=#05ff9b, transp=100, title="High Band")
l_band_plot = plot(l_band, color=#ff0583, transp=100, title="Low Band")

//Band Fills
fill(h_band_plot, filt_plot, color=#00b36b, transp=85, title="High Band Fill")
fill(l_band_plot, filt_plot, color=#b8005d, transp=85, title="Low Band Fill")

//Bar Color
barcolor(bar_color)

//External Trend Output
plot(fdir, transp=100, editable=false, display=display.none, title="External Output - Trend Signal")

// Trading Conditions Logic
longCond = close > filt and close > close[1] and upward > 0 or close > filt and close < close[1] and upward > 0
shortCond = close < filt and close < close[1] and downward > 0 or close < filt and close > close[1] and downward > 0

CondIni = 0
CondIni := longCond ? 1 : shortCond ? -1 : CondIni[1]
longCondition = longCond and CondIni[1] == -1
shortCondition = shortCond and CondIni[1] == 1

// Strategy Entry and Exit
strategy.entry("Buy", strategy.long, when = longCondition)
strategy.entry("Sell", strategy.short, when = shortCondition)

// New: Close conditions based on percentage change
long_take_profit_condition = close > strategy.position_avg_price * (1 + take_profit_percent / 100)
short_take_profit_condition = close < strategy.position_avg_price * (1 - take_profit_percent / 100)

long_stop_loss_condition = close < strategy.position_avg_price * (1 - stop_loss_percent / 100)
short_stop_loss_condition = close > strategy.position_avg_price * (1 + stop_loss_percent / 100)

strategy.close("Buy", when = shortCondition or long_take_profit_condition or long_stop_loss_condition)
strategy.close("Sell", when = longCondition or short_take_profit_condition or short_stop_loss_condition)

// Plot Buy and Sell Labels
plotshape(longCondition, title = "Buy Signal", text ="BUY", textcolor = color.white, style=shape.labelup, size = size.normal, location=location.belowbar, color = color.green, transp = 0)
plotshape(shortCondition, title = "Sell Signal", text ="SELL", textcolor = color.white, style=shape.labeldown, size = size.normal, location=location.abovebar, color = color.red, transp = 0)

// Alerts
alertcondition(longCondition, title="Buy Alert", message = "BUY")
alertcondition(shortCondition, title="Sell Alert", message = "SELL")