개요
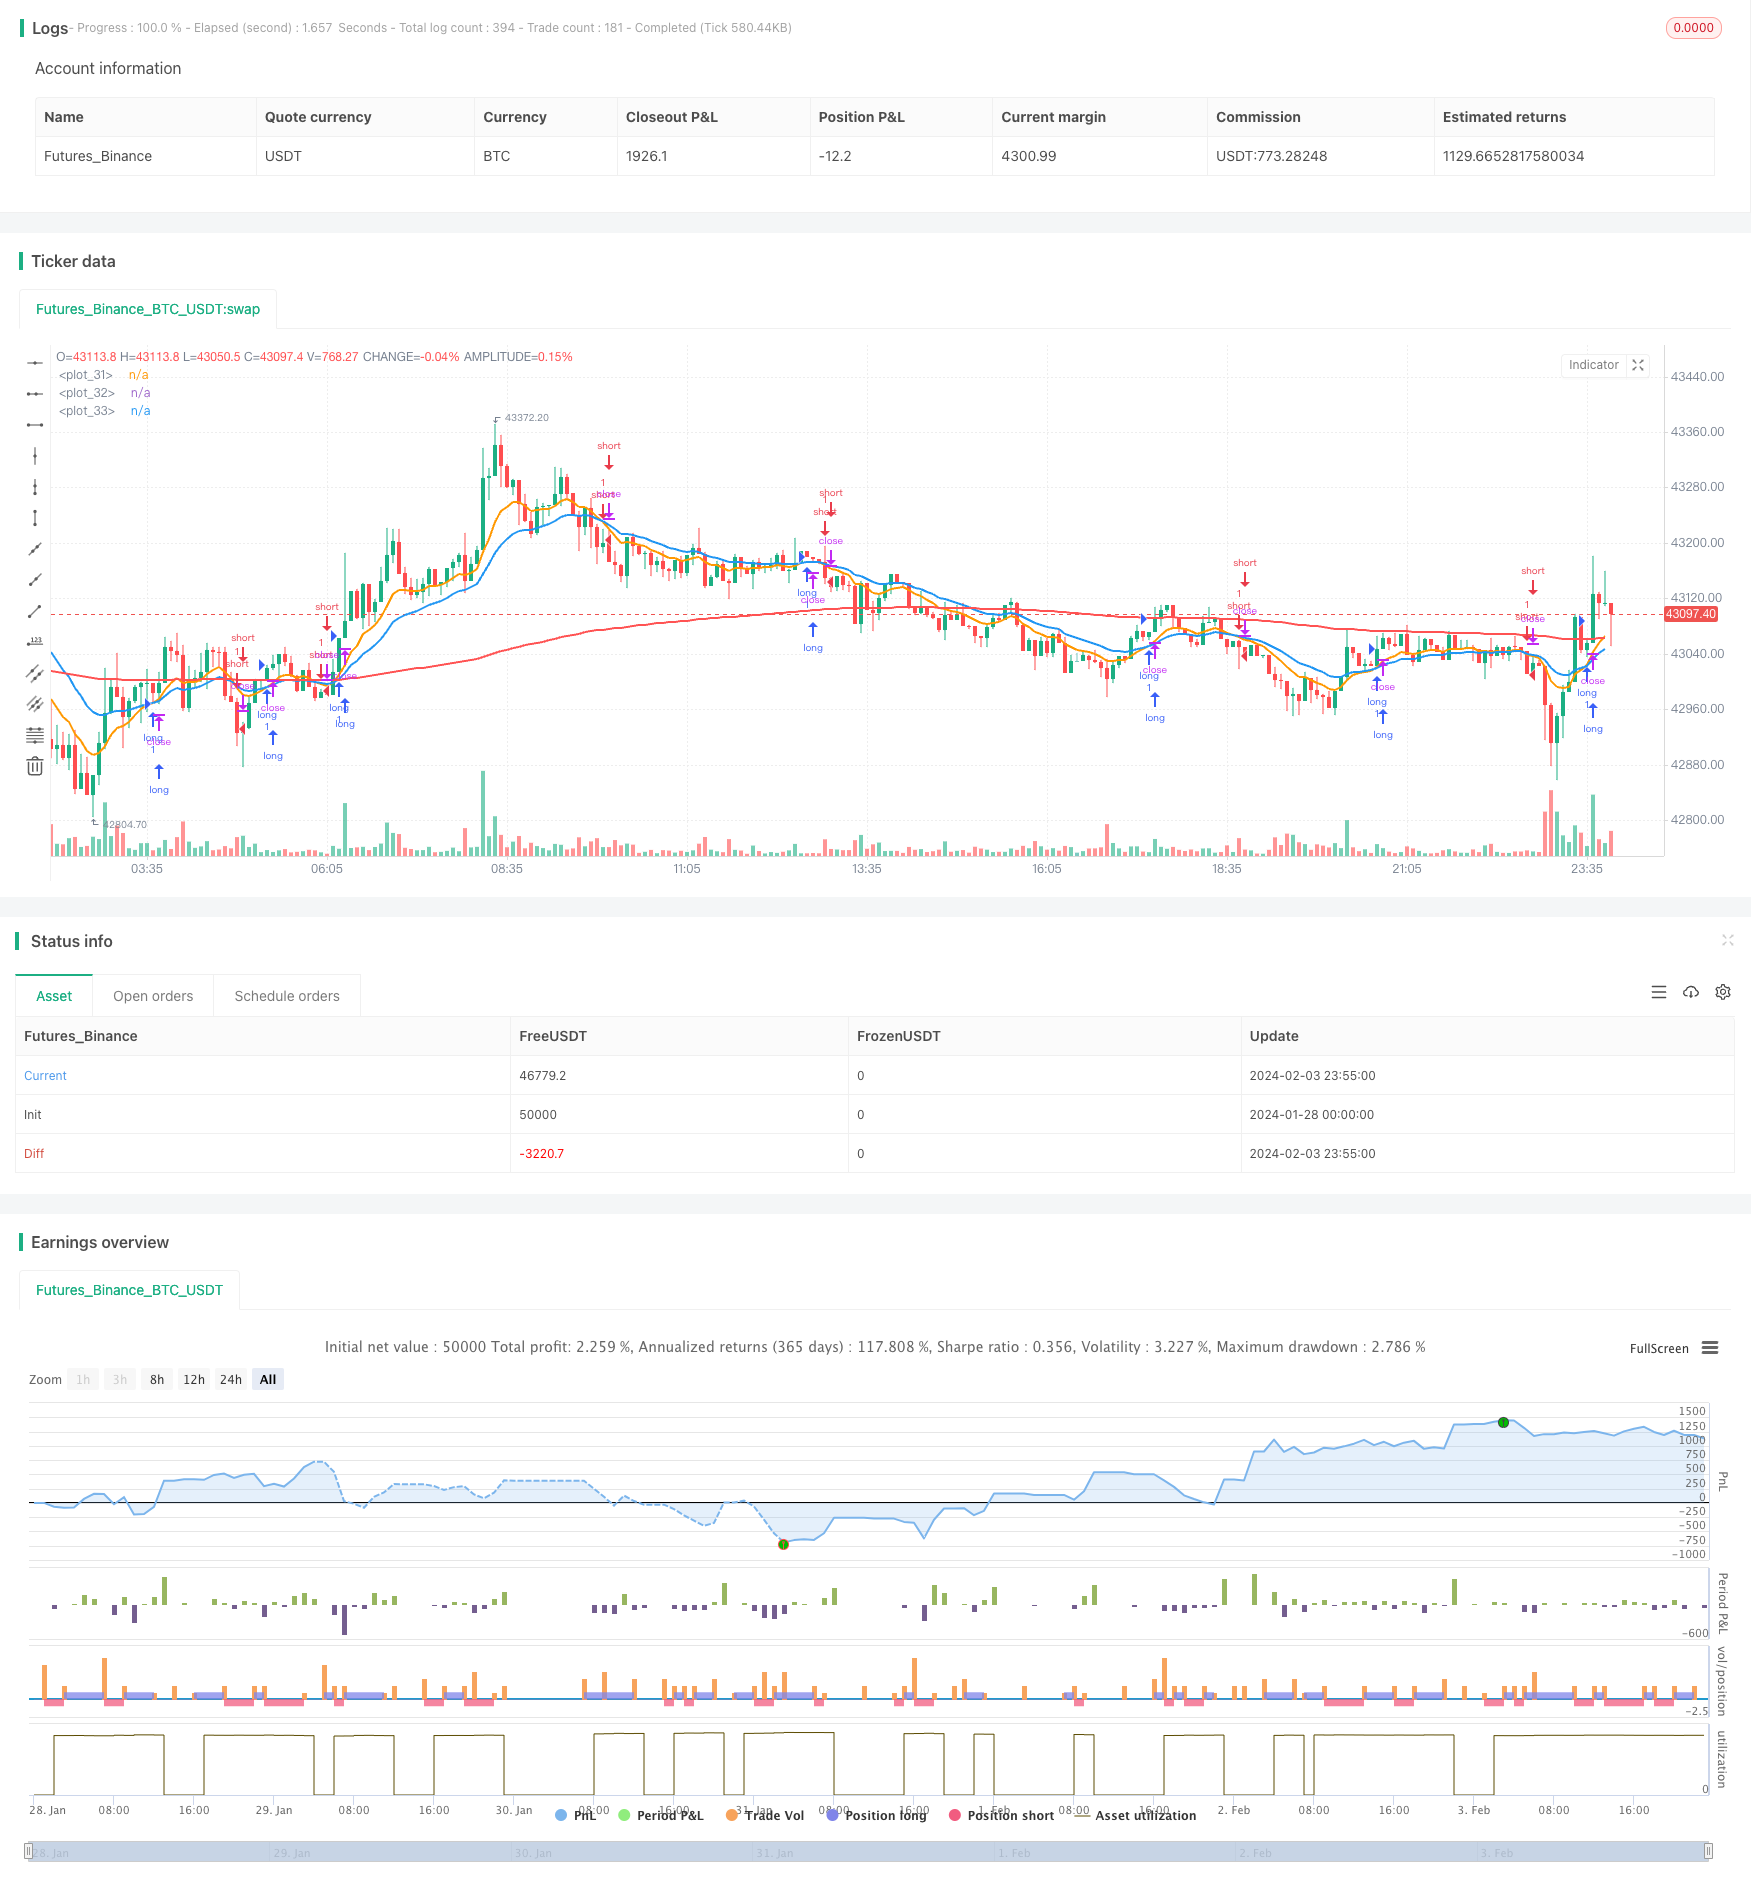
이동 평균선 교차 트렌드 추적 전략은 시장 트렌드를 추적하는 양적 거래 전략이다. 이 전략은 빠른 이동 평균선과 느린 이동 평균선을 계산하여 교차하는 경우 거래 신호를 생성하여 시장 트렌드의 전환점을 포착한다.
전략 원칙
이 전략의 핵심 원칙은 서로 다른 파라미터의 지수 이동 평균 (EMA) 을 사용하여 시장 추세를 판단하는 것이다. 전략에는 빠른 EMA와 느린 EMA가 정의되어 있다. 빠른 EMA가 아래에서 느린 EMA를 통과하면 시장 추세가 거꾸로 올 것이고, 빠른 EMA가 위에서 아래로 느린 EMA를 통과하면 시장 추세가 거꾸로 떨어진다.
상복할 때, 전략은 더 많은 카드를 열고, 하복할 때, 전략은 빈 카드를 열는다. 전략은 스톱 스톱 손실이 발생하거나 다시 교차 역전 신호가 발생하기 전까지 포지션을 유지한다.
우위 분석
이 전략은 다음과 같은 장점을 가지고 있습니다.
- 전략의 논리는 간단하고 명확하며, 이해하기 쉬운 구현으로 초보자 학습에 적합합니다.
- EMA 평평한 가격을 사용하여 시장 소음을 효과적으로 필터링하고 추세를 식별할 수 있습니다.
- 시장의 다른 주기에 맞춰 변수를 유연하게 조정할 수 있습니다.
- 전략은 다중 시간 주기 버전으로 확장되어 안정성을 높일 수 있다.
위험 분석
이 전략에는 몇 가지 위험도 있습니다.
- “이런 상황에서는 여러 번의 손실이 발생할 수 있고, 이윤에 영향을 미칠 수 있습니다.
- 트렌드 유형을 효과적으로 식별할 수 없는 경우 (고소/하위) 는 심각한 손실을 초래할 수 있습니다.
- EMA 파라미터를 잘못 설정하면 거래 빈도가 너무 높거나 인식 지연이 발생할 수 있습니다.
위험을 줄이기 위해, 다른 지표와 결합하여 트렌드 유형을 판단하거나, 좀 더 느슨한 스톱 손실 비율을 설정하는 것을 고려할 수 있습니다.
최적화 방향
이 전략은 다음과 같은 부분에서 최적화될 수 있습니다.
- 트렌드 유형에 대한 판단을 높이고 역으로 포지션을 개시하는 것을 피하십시오.
- 더 많은 시간 주기의 판단을 통해 신호의 질을 향상시킵니다.
- 동적으로 정지/정지 비율을 조정하고, 출구점을 최적화합니다.
- 다른 지표와 함께 필터링 신호를 사용하여 오차 거래를 줄여줍니다.
요약하다
이동 평행선 교차 트렌드 추적 전략은 전체적으로 간단하고 실용적인 트렌드 거래 전략이다. 이 전략의 핵심 아이디어는 명확하고 실행하기 쉽고, 또한 약간의 최적화 공간이 존재한다. 매개 변수 조정, 다중 주기 판단, 동적 중지 등의 방법으로 전략의 안정성과 수익 수준을 지속적으로 향상시킬 수 있다.
전략 소스 코드
/*backtest
start: 2024-01-28 00:00:00
end: 2024-02-04 00:00:00
period: 5m
basePeriod: 1m
exchanges: [{"eid":"Futures_Binance","currency":"BTC_USDT"}]
*/

//@version=5
strategy('Zhukov trade', overlay=true, calc_on_every_tick=true, currency=currency.USD)

// INPUT:

// Options to enter fast and slow Exponential Moving Average (EMA) values
emaFast = input.int(title='Fast EMA', defval=10, minval=1, maxval=9999)
emaSlow = input.int(title='Slow EMA', defval=20, minval=1, maxval=9999)

// Option to select trade directions
tradeDirection = input.string(title='Trade Direction', options=['Long', 'Short', 'Both'], defval='Both')

// Options that configure the backtest date range
startDate = input(title='Start Date', defval=timestamp('01 Jan 2023 00:00'))
endDate = input(title='End Date', defval=timestamp('31 Dec 2030 23:59'))

// Set take profit and stop loss percentages
take_profit_percent = input(1.0, title ="Take Profit Percent") / 100.0
stop_loss_percent = input(1.0, title ="Stop Loss Percent") / 100.0

// CALCULATIONS:

// Use the built-in function to calculate two EMA lines
fastEMA = ta.ema(close, emaFast)
slowEMA = ta.ema(close, emaSlow)
emapos = ta.ema(close, 200)

// PLOT:

// Draw the EMA lines on the chart
plot(series=fastEMA, color=color.new(color.orange, 0), linewidth=2)
plot(series=slowEMA, color=color.new(color.blue, 0), linewidth=2)
plot(series=emapos, color=color.new(color.red, 0), linewidth=2)

// CONDITIONS:

// Check if the close time of the current bar falls inside the date range
inDateRange = true

// Translate input into trading conditions
longOK = tradeDirection == 'Long' or tradeDirection == 'Both'
shortOK = tradeDirection == 'Short' or tradeDirection == 'Both'

// Decide if we should go long or short using the built-in functions
longCondition = ta.crossover(fastEMA, slowEMA) and inDateRange
shortCondition = ta.crossunder(fastEMA, slowEMA) and inDateRange

// ORDERS:

// Submit entry (or reverse) orders
if longCondition and longOK
    strategy.entry(id='long', direction=strategy.long)

if shortCondition and shortOK
    strategy.entry(id='short', direction=strategy.short)

// Exit orders
if strategy.position_size > 0 and longOK
    strategy.exit(id='exit long', from_entry='long', limit=strategy.position_avg_price * (1 + take_profit_percent), stop=strategy.position_avg_price * (1 - stop_loss_percent))

if strategy.position_size < 0 and shortOK
    strategy.exit(id='exit short', from_entry='short', limit=strategy.position_avg_price * (1 - take_profit_percent), stop=strategy.position_avg_price * (1 + stop_loss_percent))