더블 인버전 모멘텀 인덱스 전략

1
Follow
1782
Followers
개요
이중 역동량 지수 전략은 123 역동량 전략과 상대 역동량 지수 ((RMI) 전략을 결합한 조합 전략이다. 이중 신호를 이용하여 거래 의사결정의 정확성을 높이기 위한 것이다.
전략 원칙
이 전략은 두 부분으로 구성되어 있습니다.
-
123 역전 전략
- 어제의 종결값이 전날보다 낮고, 오늘의 종결값이 전날보다 높고, 9일 슬로우 K 선이 50보다 낮을 때, 더 많은 것을 해라
- 어제의 종결값이 전날보다 높고, 오늘의 종결값이 전날보다 낮고, 9일 Fast K 선이 50보다 높을 때
-
상대 운동량 지수 (RMI) 전략
- RMI는 RSI의 기초에 동력 인자의 변형을 더한다. 그것은 다음과 같은 공식으로 계산된다: RMI = (상행량 SMA) / (하행량 SMA) * 100
- RMI가 오버 바이 라인보다 낮으면 더 많이 팔고, RMI가 오버 세일 라인보다 높으면 더 많이 팔지
이 조합 전략은 123 회전과 RMI 이중 신호가 동방향으로 발송될 때만 거래 신호를 생성한다. 이것은 잘못된 거래의 기회를 효과적으로 줄일 수 있다.
전략적 강점 분석
이 전략은 다음과 같은 장점을 가지고 있습니다.
- 이중 지표와 결합하여 신호의 정확성을 향상시킵니다.
- 위기 상황에 맞게 역전 전략을 사용한다
- RMI 지표는 강력한 트렌드의 전환점을 인식하는 데 민감합니다.
전략적 위험 분석
이 전략에는 몇 가지 위험도 있습니다.
- 이중 필터링으로 거래 기회를 놓칠 수 있습니다.
- 반전 신호는 오차를 일으킬 수 있습니다.
- RMI 파라미터를 잘못 설정하면 결과가 달라집니다.
이러한 위험은 변수 조합을 조정하고, 지표 계산 방법을 최적화하여 줄일 수 있습니다.
전략 최적화 방향
이 전략은 다음과 같은 부분에서 최적화될 수 있습니다.
- 다양한 변수 조합을 테스트하여 최적의 변수를 찾습니다.
- KDJ, MACD 등과 같은 다양한 역전 지표 조합을 시도해 보세요.
- RMI 공식에 대한 수정, 더 민감하게
- 단편적 손실을 통제하기 위한 손해 방지 장치를 추가합니다.
- 거래량과 함께 가짜 신호를 피하십시오.
요약하다
이중 반전량 지수 전략은 이중 신호 필터링과 변수 최적화를 통해 거래 의사 결정의 정확성을 효과적으로 향상시키고 잘못된 신호의 확률을 줄일 수 있습니다. 그것은 흔들리는 상황에 적용되며 반전 기회를 활용할 수 있습니다. 이 전략은 변수를 조정하고 지표 계산 방법을 최적화하여 효과와 laps 위험을 더욱 향상시킬 수 있습니다.
Source
Pine
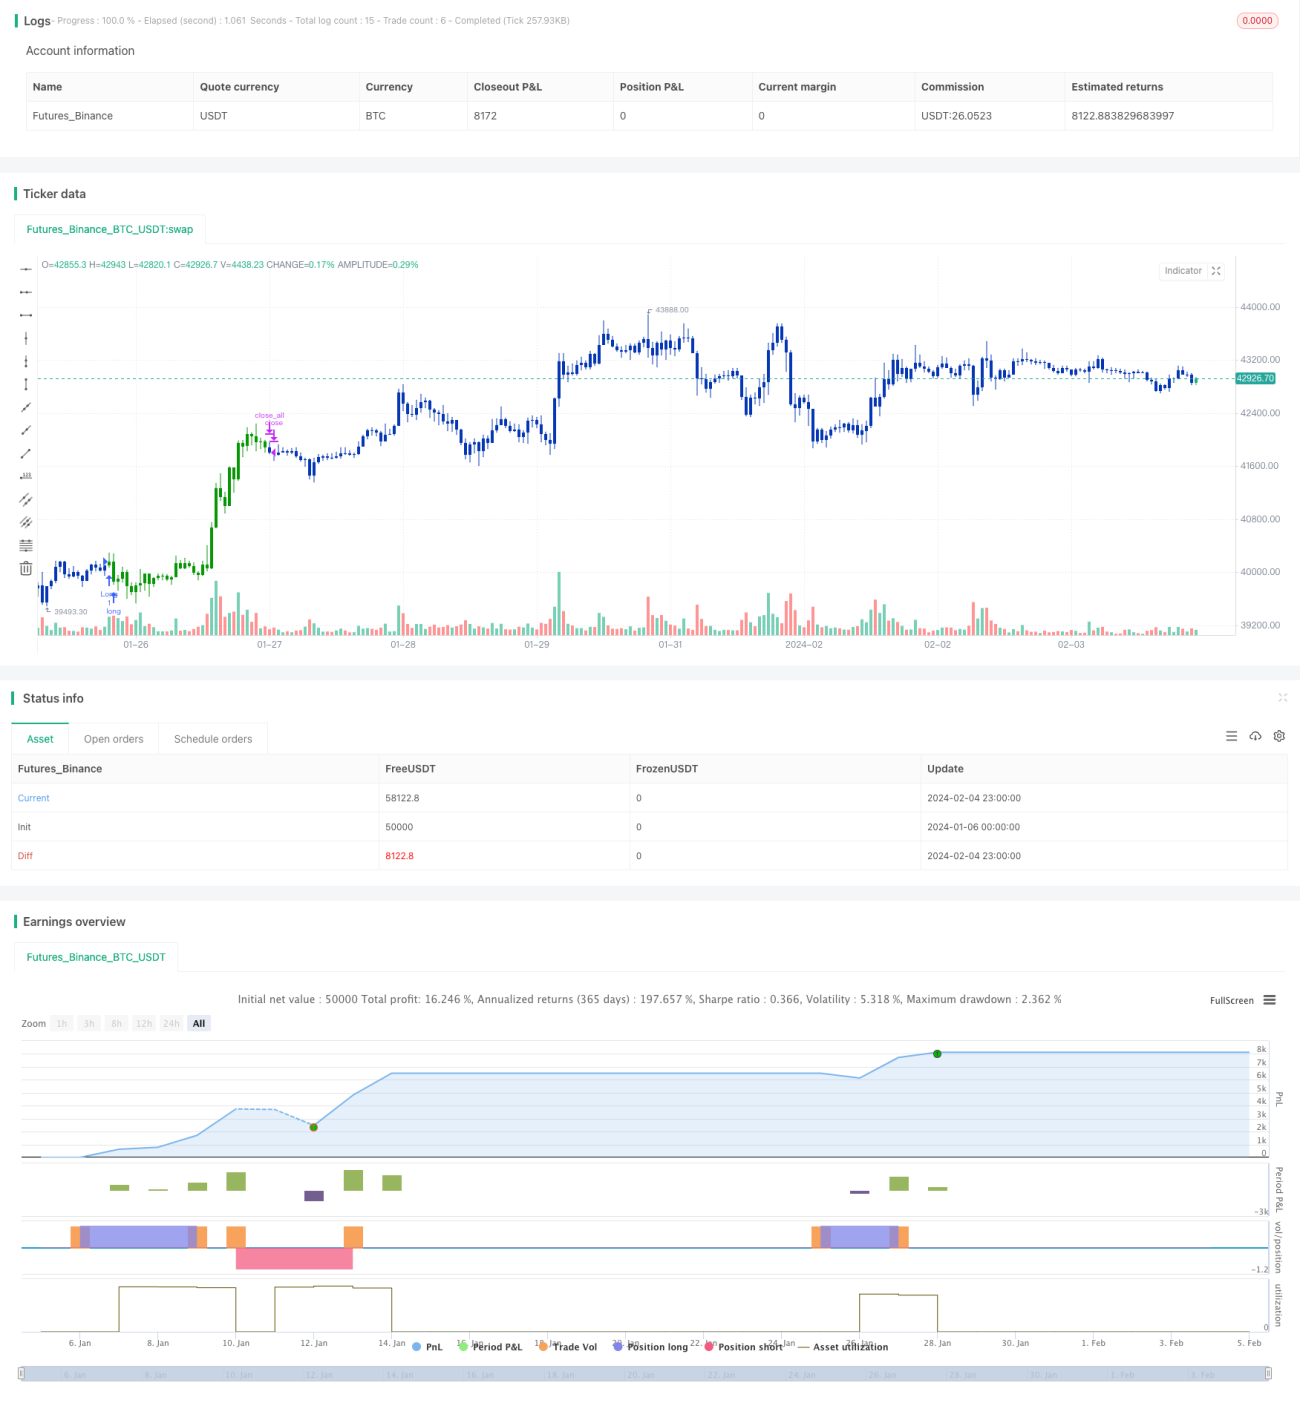
/*backtest
start: 2024-01-06 00:00:00
end: 2024-02-05 00:00:00
period: 1h
basePeriod: 15m
exchanges: [{"eid":"Futures_Binance","currency":"BTC_USDT"}]
*/

//@version=4
////////////////////////////////////////////////////////////
//  Copyright by HPotter v1.0 07/06/2021
// This is combo strategies for get a cumulative signal. Strategy parameters
Related strategies
Comment
All comments (0)
No data
- 1