개요
이 전략의 핵심 아이디어는 동적 기울기를 사용하여 가격 트렌드 방향을 판단하고, 돌파 판단과 결합하여 거래 신호를 생성하는 것입니다. 구체적으로, 그것은 실시간으로 가격의 새로운 최고점과 새로운 최저점을 추적하고, 다른 시간 동안의 가격 변화에 따라 동적 기울기를 계산하고, 추세 선에 대한 가격 돌파를 결합하여 다공개 신호를 판단합니다.
전략 원칙
이 전략은 다음과 같은 몇 가지 단계로 구성됩니다.
최고 가격과 최저 가격을 판단: 특정 주기 (예: 20 K 선) 내의 최고 가격과 최저 가격을 추적하여 혁신 높은 가격이나 새로운 낮은 가격을 판단합니다.
역동적인 기울기를 계산한다: 혁신의 높은 또는 새로운 낮은 K 라인 번호를 기록하고, 혁신의 높은 낮은 지점에서 특정 주기 (예: 9 K 라인) 이후의 높은 낮은 지점의 역동적인 기울기를 계산한다
트렌드 라인을 그리기: 동적인 기울기에 따라 상승과 하락의 트렌드 라인을 그리기
연장 및 업데이트 트렌드 라인: 가격이 트렌드 라인을 뚫을 때 트렌드 라인을 연장 및 업데이트합니다.
거래 신호: 가격의 트렌드 라인을 뚫고 상장 및 하락 신호를 판단합니다.
전략적 이점
이 전략은 다음과 같은 장점을 가지고 있습니다.
동적으로 트렌드 방향을 판단하고 시장 변화에 유연하게 대응할 수 있습니다.
상쇄 손실을 합리적으로 통제할 수 있고,
브레이크 트레이딩 신호가 명확하고 실행이 간단합니다.
사용자 정의 가능한 파라미터, 적응력
코드 구조가 명확하고, 이해하기 쉽고, 재개발이 가능합니다.
위험과 해결책
이 전략에는 몇 가지 위험도 있습니다.
트렌드가 흔들리면 필터링 조건을 추가하는 것이 좋습니다.
돌파 가짜 신호가 더 많을 수 있으며, 적절한 매개 변수를 조정하거나 필터 조건을 추가할 수 있다.
급격한 변동이 발생했을 때 단축 위험은 단축 위험을 증가시킬 수 있습니다.
제한된 최적화 공간, 단선 거래에 적합한 수익성 제한
최적화 방향
이 정책이 개선될 수 있는 부분은 다음과 같습니다.
필터링 신호를 판단하는 더 많은 기술 지표를 추가합니다.
최적화 변수 모음, 최적의 변수를 찾아
“지난 몇 년 동안, 저는 이 문제를 해결하기 위해 많은 노력을 기울였습니다.
자동으로 출전폭을 조정하는 기능을 추가합니다.
다른 전략과 결합하여 더 많은 기회를 찾아보세요.
요약하다
이 전략은 전체적으로 동적 기울기 판단 트렌드를 기반으로 거래를 돌파하는 효율적인 단선 전략이다. 그것은 시장에서 단선 기회를 잡기 위해 사용되는 정확하고, 위험은 제어할 수 있다. 파라미터를 추가적으로 최적화하고 필터 조건을 추가함으로써 전략의 승률과 수익 수준을 향상시킬 수 있다.
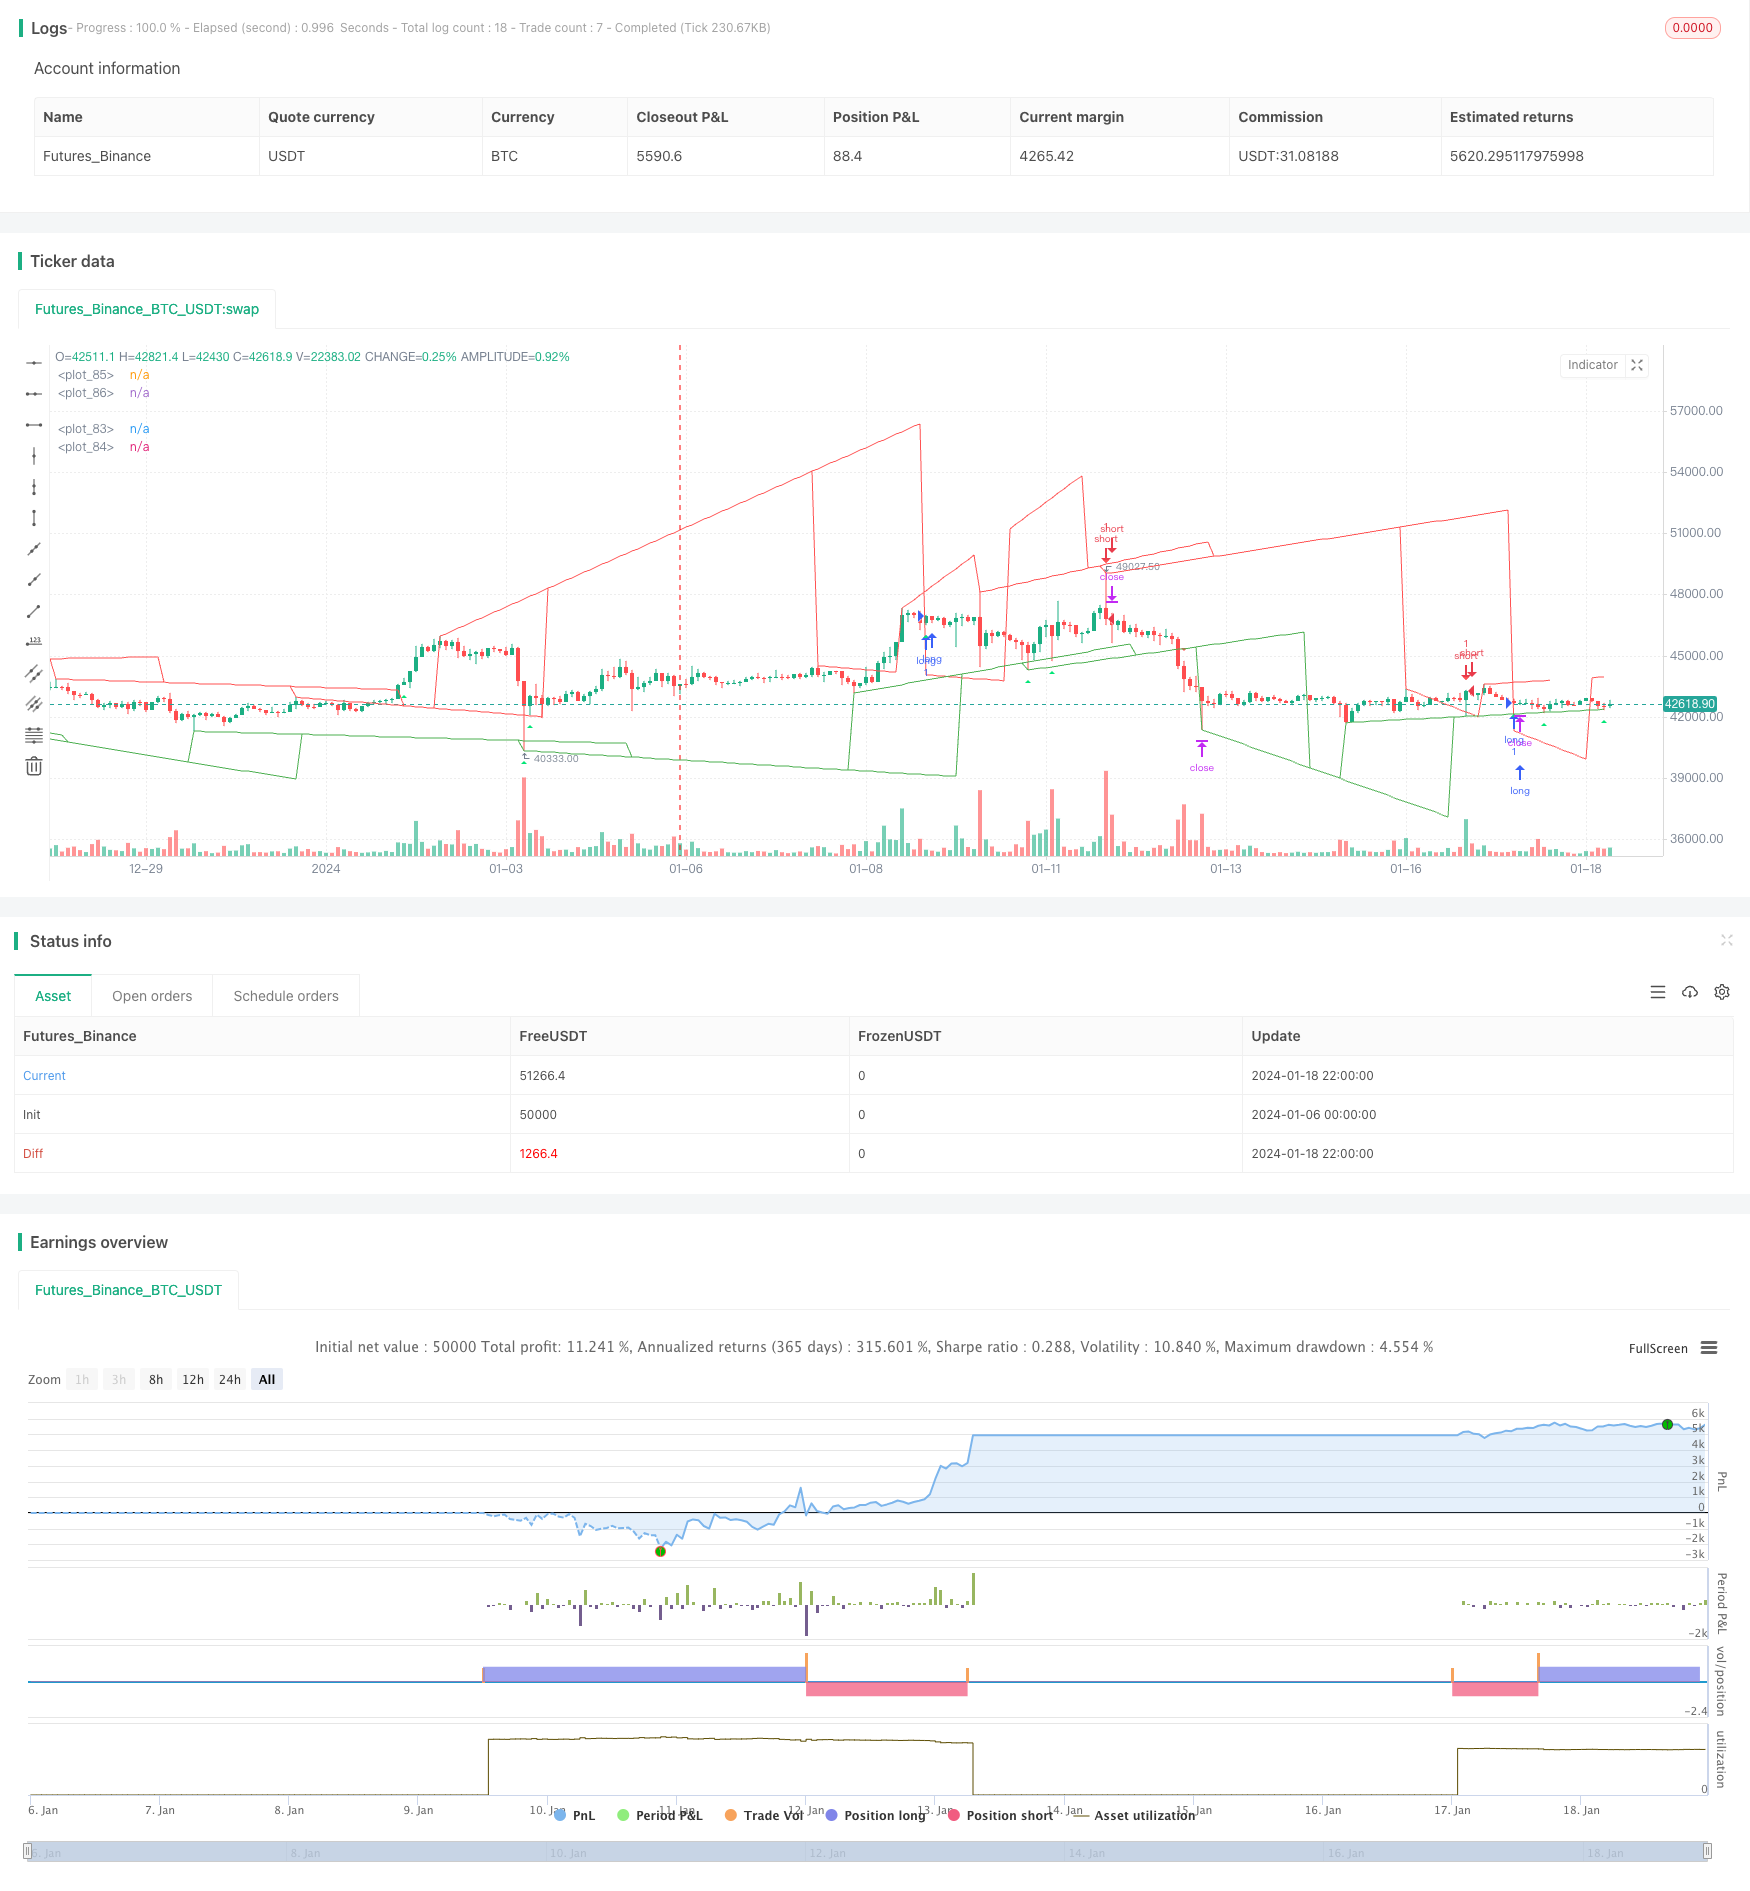
/*backtest
start: 2024-01-06 00:00:00
end: 2024-01-19 00:00:00
period: 2h
basePeriod: 15m
exchanges: [{"eid":"Futures_Binance","currency":"BTC_USDT"}]
*/

// This source code is subject to the terms of the Mozilla Public License 2.0 at https://mozilla.org/MPL/2.0/
// © pune3tghai

//Originally posted by matsu_bitmex

//tried adding alerts on plots and cleared the chart for a cleaner view.
//Publishing the script in hope of getting it improved by someone else.

//Added strategy code for easier calculations

//Needs work on TP and SL part.

//P.S - THE ORIGINAL CODE IS MUCH BETTER BUT I have tried to be more usable and understandable.

//@version=4
strategy("TrendLines with Alerts", overlay=true)     //study("TrendLines with Alerts", overlay=true)
//update

length1 = input(20)
check = input(9)
//length2 = input(200)


u=0.0
u := u[1]

l=0.0
l := l[1]

y=0.0
y := y[1]

yl=0.0
yl := yl[1]

angle = 0.0
angle := angle[1]

anglel = 0.0
anglel := anglel[1]

if (highest(length1) == high[check] and highest(length1) == highest(length1)[check] and barssince(barstate.isfirst) > check)
    u := high[check]


if (lowest(length1) == low[check] and lowest(length1) == lowest(length1)[check] and barssince(barstate.isfirst) > check)
    l := low[check]


p = round(barssince(u == high[check]))

pl = round(barssince(l == low[check]))

if p == 0 and barssince(barstate.isfirst) > check
    y := high[abs(p[1]+1+check)]

if pl == 0 and barssince(barstate.isfirst) > check
    yl := low[abs(pl[1]+1+check)]


if p == 0
    angle := (u-y)/p[1]

if pl == 0
    anglel := (l-yl)/pl[1]

uppertrend = u+ (p * angle)

lowertrend = l+ (pl * anglel)

extendup = if barssince(barstate.isfirst) > check
    uppertrend[check] + angle[check] * check*2

extenddown = if barssince(barstate.isfirst) > check
    lowertrend[check] + anglel[check] * check*2


//plot(l[offset]-u,color=red)
//plot(u[offset]-l,color = green )
plot(lowertrend, color = color.green, transp=30,offset = -check)
plot(extenddown, color = color.green, transp=100)
plot(uppertrend, color = color.red, transp=30, offset = -check)
plot(extendup, color = color.red, transp=100)
//plot(l[offset], color = red)

l1 = lowertrend
l2 = extenddown
u1 = uppertrend
u2 = extendup


l2sell = crossunder(high, l2)
u2buy = crossover(low, u2)
buy1 = (low<=lowertrend) and open>lowertrend and high>lowertrend and close>lowertrend
buy2 = (low<=extenddown) and open>extenddown and high>extenddown and close>extenddown
buy = buy1 or buy2 or u2buy
plotshape(series=buy, title="Buy", style=shape.triangleup, size=size.tiny, color=color.lime, location=location.belowbar)
sell1 = (high>=uppertrend) and open<uppertrend and low<uppertrend and close<uppertrend
sell2 = (high>=extendup) and open<extendup and low<extendup and close<extendup
sell = sell1 or sell2 or l2sell
plotshape(series=sell, title="Sell", style=shape.triangledown, size=size.tiny, color=color.red, location=location.abovebar)

longCond = buy
shortCond = sell

tp = input(0.2, title="Take Profit")

tpbuyval = valuewhen(buy, close, 1) + (tp/100)*(valuewhen(buy, close, 1))
tpsellval = valuewhen(sell, close, 1) - (tp/100)*(valuewhen(sell, close, 1))


sl = input(0.2, title="Stop Loss")
slbuyval = valuewhen(buy, close, 0) - (sl/100)*(valuewhen(buy, close, 0))
slsellval = valuewhen(sell, close, 0) + (sl/100)*(valuewhen(sell, close, 0))
// === STRATEGY ===
tradeType = input("BOTH", title="What trades should be taken : ", options=["LONG", "SHORT", "BOTH", "NONE"])

// stop loss
slPoints = input(defval=0, title="Initial Stop Loss Points (zero to disable)", minval=0)
tpPoints = input(defval=0, title="Initial Target Profit Points (zero for disable)", minval=0)

//>>>>>>>>>>>>>>>>>>>>>>>>>>>>>>>>>>>>>>>>>>>>>>>>>>>>>>>>>>>>>>>>>>>>>>>>>>>>>//

testStartYear = input(2019, "Backtest Start Year", minval=1980)
testStartMonth = input(1, "Backtest Start Month", minval=1, maxval=12)
testStartDay = input(1, "Backtest Start Day", minval=1, maxval=31)
testPeriodStart = timestamp(testStartYear, testStartMonth, testStartDay, 0, 0)

testStopYear = input(9999, "Backtest Stop Year", minval=1980)
testStopMonth = input(12, "Backtest Stop Month", minval=1, maxval=12)
testStopDay = input(31, "Backtest Stop Day", minval=1, maxval=31)
testPeriodStop = timestamp(testStopYear, testStopMonth, testStopDay, 0, 0)

testPeriod() =>
    time >= testPeriodStart and time <= testPeriodStop ? true : false

//<<<<<<<<<<<<<<<<<<<<<<<<<<<<<<<<<<<<<<<<<<<<<<<<<<<<<<<<<<<<<<<<<<<<<<<<<<<<<//

//
//set up exit parameters
TP = tpPoints > 0 ? tpPoints : na
SL = slPoints > 0 ? slPoints : na

// Make sure we are within the bar range, Set up entries and exit conditions
if testPeriod() and tradeType != "NONE"
    strategy.entry("long", strategy.long, when=longCond == true and tradeType != "SHORT")
    strategy.entry("short", strategy.short, when=shortCond == true and tradeType != "LONG")
    strategy.close("long", when=shortCond == true and tradeType == "LONG")
    strategy.close("short", when=longCond == true and tradeType == "SHORT")
    strategy.exit("XL", from_entry="long", profit=tpbuyval, loss=slbuyval)
    strategy.exit("XS", from_entry="short", profit=tpsellval, loss=slsellval)

// === /STRATEGY ===
//EOF


////ALERT SYNTEX
//alertcondition(longCond, title="Long", message="Killer Market")
//alertcondition(shortCond, title="Short", message="Poopy Market")