동적 트레일링 스톱 롱 포지션과 계절 필터를 사용한 가격 돌파 전략

개요
이 전략은 동적 이동 지표 ((DMI) 를 기반으로 여러 개의 긴 라인 전략을 설계하고, 평균 실제 파장 ((ATR) 과 결합하여 손실 위험을 제어하기 위해 후속 손실을 수행합니다. 추가 최적화를 위해 이 전략은 거래 시간 및 S&P 500 지수의 계절적 필터링 조건을 통합하고 있습니다.
전략 원칙
-
이 전략은 지정된 거래일 (월요일부터 금요일까지) 과 거래 시간 (현지 시간 9시 30분부터 20시 30분까지) 에만 포지션을 열 수 있습니다.
-
ADX가 27보다 크면 현재 가격 트렌드 상태임을 나타냅니다. 이 때 +DI 라인이 DI 라인을 통과하면 멀티 신호가 발생한다.
-
포지션을 개시한 후, ATR의 5.5배로 스톱로스를 설정하고, 스톱 라인은 가격 상승에 따라 올라갈 수 있도록 하여 수익을 보장한다.
-
선택적으로 스탠퍼드 500 지수의 계절적 규칙을 적용하고, 역사적으로 더 잘하는 시기에만 포지션을 개설한다.
우위 분석
-
트렌드 지표와 스톱 로드 메커니즘을 결합하여 트렌드를 효과적으로 추적하고 각각의 포지션의 손실을 제어할 수 있습니다.
-
거래시간과 계절적 필터링 조건을 활용하여 시장의 비정상적인 변동기를 피할 수 있고, 잘못된 보고율을 줄일 수 있다.
-
DMI와 ATR은 모두 정교한 기술 지표이며, 파라미터를 조정할 수 있으며, 양적 최적화에 적합하다.
위험 분석
-
DMI 및 ATR 파라미터를 잘못 설정하면 신호가 너무 많거나 너무 적을 수 있다. 테스트를 위해 파라미터를 조정해야 한다.
-
스톱로스는 불필요한 스톱로스를 크게 설정하고, 작은 스톱로스는 손실을 효과적으로 제어할 수 없다.
-
거래 시간 및 계절적 규칙은 수익의 일부를 필터링 할 수 있습니다.
최적화 방향
-
MACD, 브린 띠 등과 같은 다른 지표와 결합하여 기입 및 출전 규칙을 설계할 수 있다.
-
다른 ATR 곱수 상쇄 방법을 테스트할 수 있으며, 동적으로 상쇄량을 조정하는 것도 고려할 수 있다.
-
거래 시기를 조정하거나, 계절적 거래의 시작 및 종료 시간을 최적화 할 수 있습니다.
-
기계 학습 방법을 적용하여 자동 최적화 파라미터를 시도할 수 있다.
요약하다
이 전략은 트렌드 분석과 리스크 제어 기술을 통합하여 트렌드 추적 전략의 급격한 변동 문제를 어느 정도 극복합니다. 동시에 거래 시간 및 계절적 필터를 추가하여 잘못된 신호를 줄일 수 있습니다. 이 전략은 파라미터 조정 및 기능 확장을 통해 더 나은 안정적인 수익을 얻을 수 있습니다.
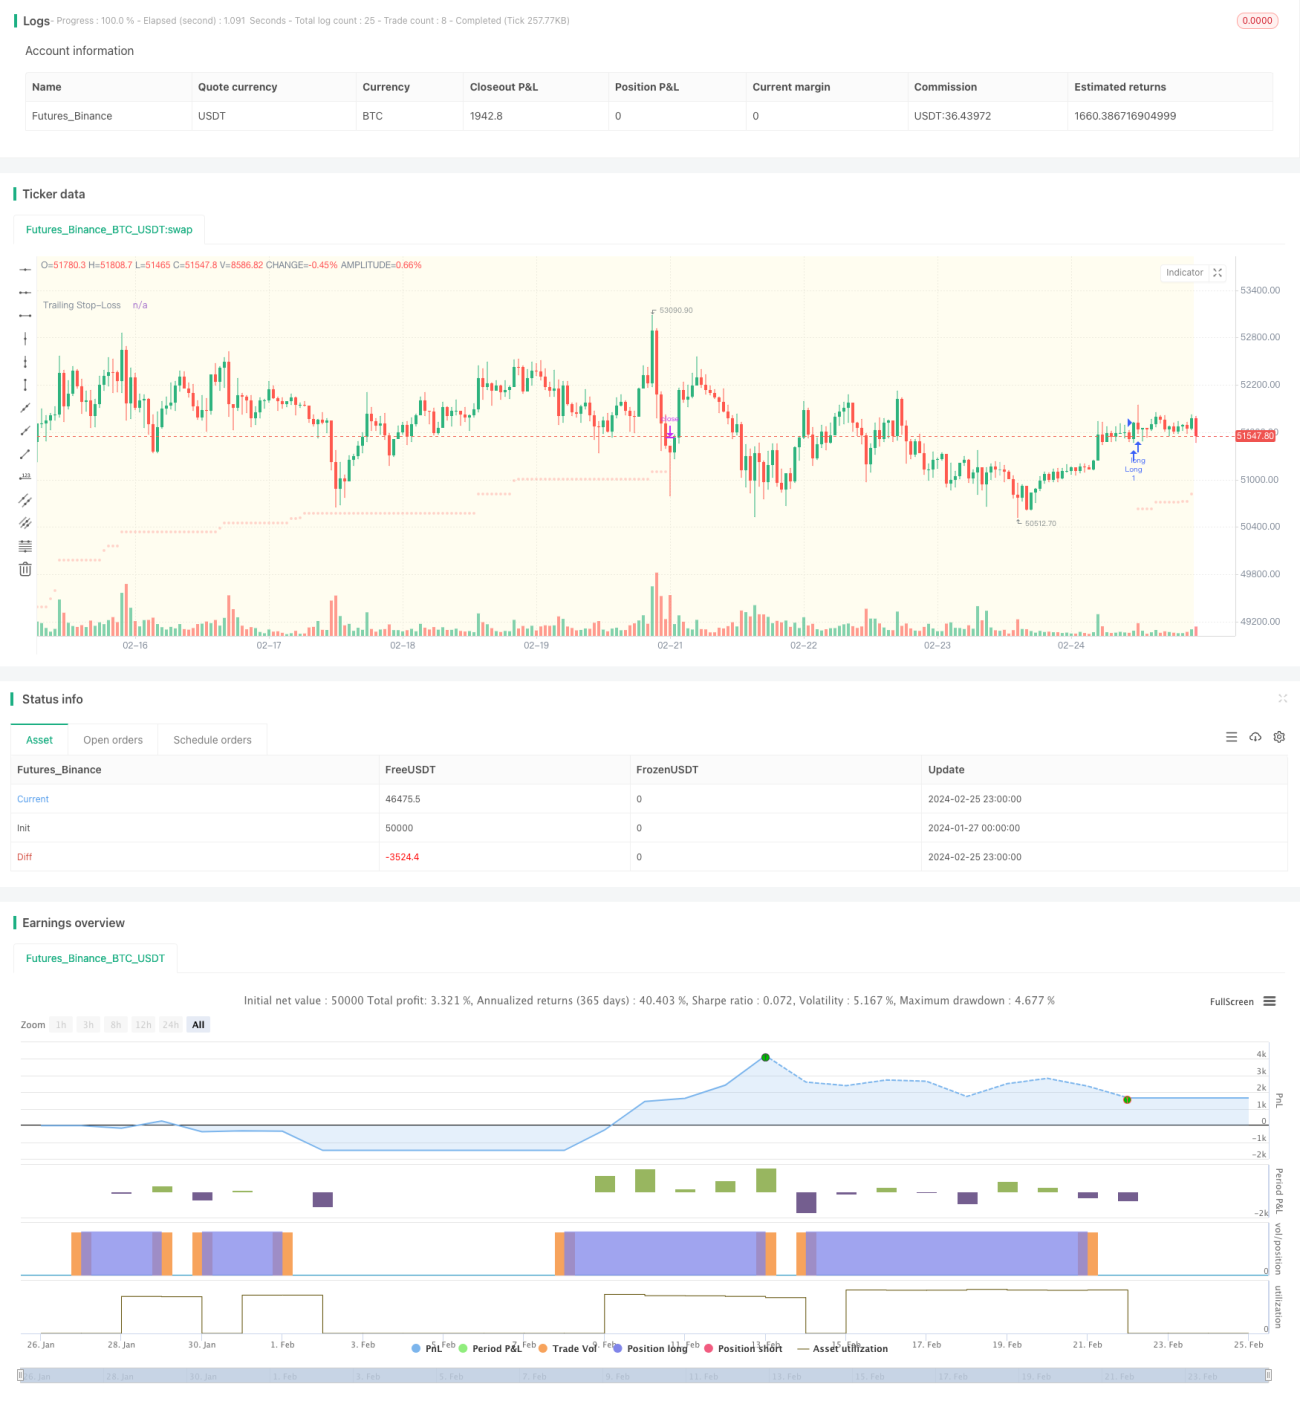
/*backtest
start: 2024-01-27 00:00:00
end: 2024-02-26 00:00:00
period: 1h
basePeriod: 15m
exchanges: [{"eid":"Futures_Binance","currency":"BTC_USDT"}]
*/

//@version=5
strategy(title="DMI Strategy with ADX and ATR-based Trailing SL (Long Only) and Seasonality", shorttitle="MBV-SP500-CLIMBER", overlay=true)

// Eingabeparameter für Long-Positionen- 1