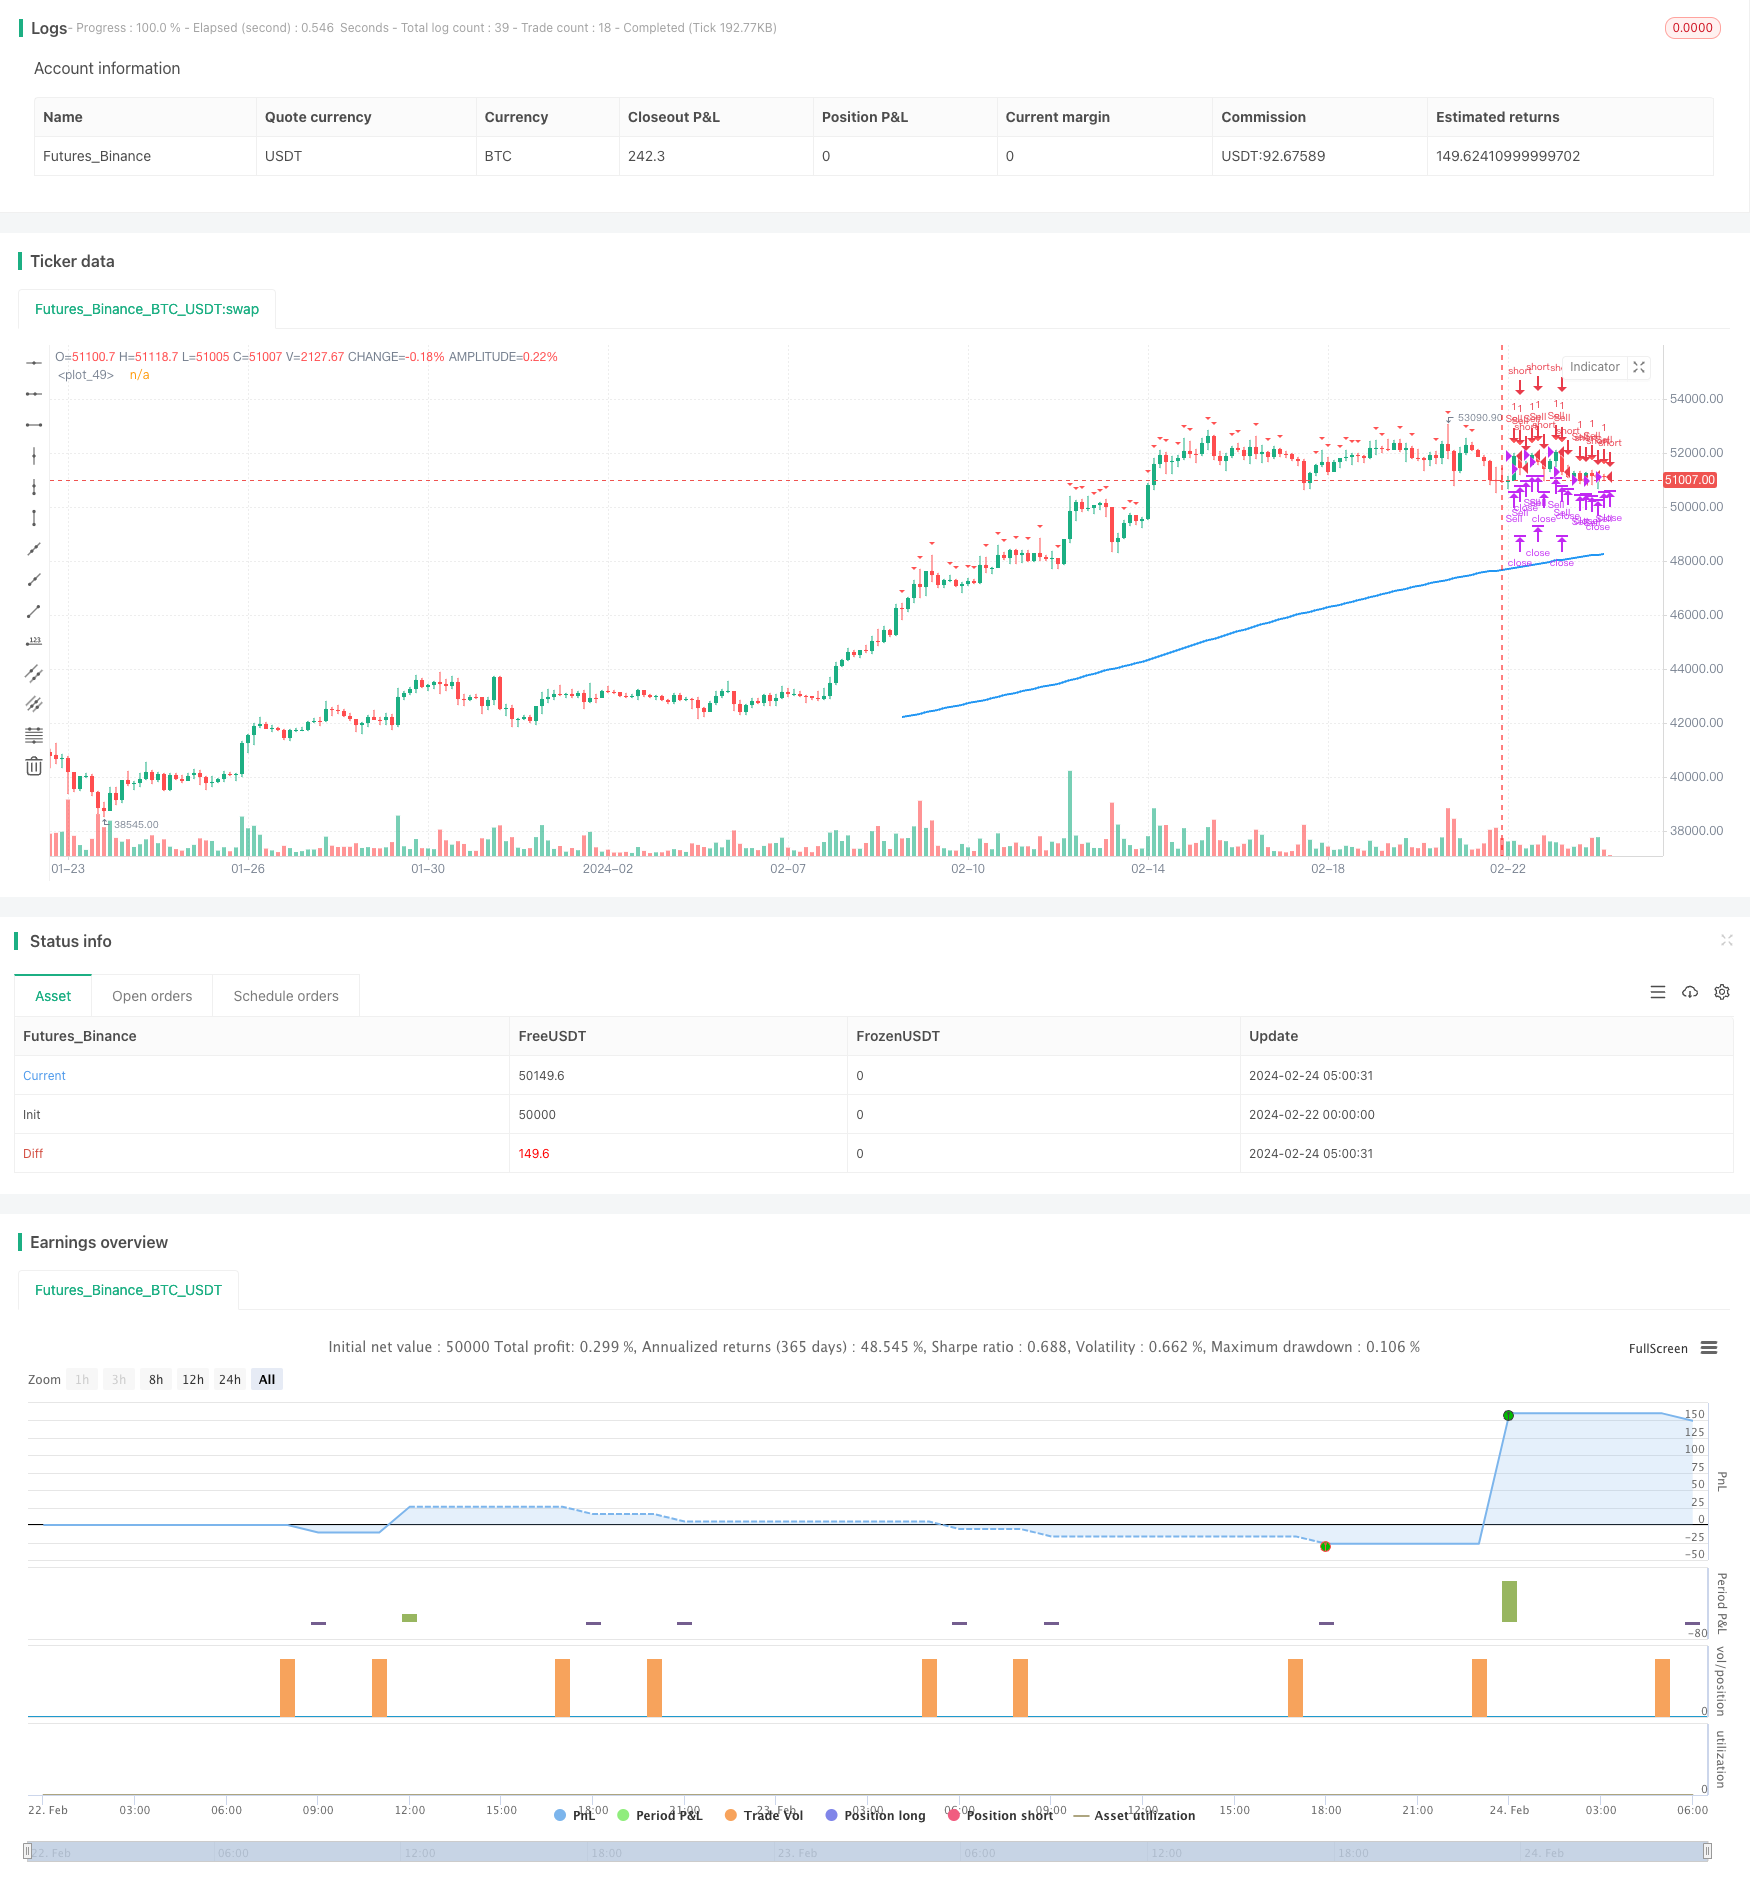
이 글은 200 일 이동 평균과 가격 거리를 기반으로 한 트렌드 추적 유형 전략을 자세히 분석 할 것입니다. 이 전략은 가격과 200 일 이동 평균의 거리를 추적하여 설정된 임계값을 초과 할 때 위치를 설정하고 수익 목표가 달성 된 후 평지 포지션을 종료합니다.
1 전략
이 전략의 핵심 지표는 200일 지수 이동 평균 ((200 EMA) 이다. 전략은 가격이 200일선에서 벗어났는지 설정된 비율을 달성한 후, 가장 최근의 K선이 양선 ((다중 입점) 또는 음선 ((공백 입점) 이었을 때 부문을 세운다. 다중 입점 조건은 가격이 200일선보다 낮고 가격이 200일선과의 거리 비율이 절댓값보다 크며, 가장 최근의 K선에서 양선으로 들어가면 더 많이 입점한다. 공백 조건은 가격이 200일선보다 높고 가격이 200일선과의 거리 비율이 절댓값보다 크며, 가장 최근의 K선에서의 음선으로 들어가면 공백이다.
출구 조건은 가격이 200일선으로 돌아가거나 스톱 목표 (입구 가격의 1.5배) 에 도달했을 때 평상시 출구이다. 옵션 신고 가치의 20%를 스톱으로 설정한다.
자세한 입장 조건은 아래와 같습니다.
많은 사람들이 입학했습니다.마감값 <200일선 그리고 마감값과 200일선 사이의 비율은 ≥값 그리고 가장 최근의 K선 마감선
공허 입학:클로즈값> 200 일선 및 클로즈값과 200 일선 사이의 비율 ≥ 절전값 및 가장 최근의 K 선의 클로즈 선
다중 출연:종결값 ≥200 일선 또는 스톱 목표치 또는 거래일 종료
공허의 출전:마감값 <=200 일선 또는 정지 목표 또는 거래일 종료
손해배상 조건은 옵션의 신고 가치의 20%이다.
2 전략적 장점
이 전략은 다음과 같은 장점을 가지고 있습니다.
- 200일 이동 평균을 사용하여 가격의 중장선 추세 방향을 판단하고, 단기 시장 소음에 방해받지 않도록 한다.
- 트렌드 추적 장치를 구축하여 중·중간 가격 추세를 추적합니다.
- 진입 시점을 최적화하고, 마지막 K선 방향이 큰 트렌드와 일치할 때 진입
- 합리적인 상쇄 및 중단 장치, 손실 확산을 방지하기
세, 전략적 위험
이 전략에는 다음과 같은 위험들이 있습니다.
- 대시장 변동시 가격의 이동 평균에 여러 번 접촉하여 손실이 발생할 수 있습니다.
- 급격한 역전으로 인해 손실로 인한 퇴출
- 설정된 파라미터, 예를 들어 이동 평균 주기 선택이 잘못되어 추세를 정확하게 판단할 수 없습니다.
위와 같은 위험을 줄이기 위해 다음과 같은 것들을 최적화할 수 있습니다.
- 이동 평균 변수를 조정하거나 다른 지표를 추가하여 큰 추세를 판단합니다.
- 가격 변화에 따라 스톱 거리 조정과 같은 스톱 메커니즘 최적화
- 입학 조건의 최적화, 더 많은 판단 지표의 추가
네, 전략적 최적화 방향
이 전략은 다음의 몇 가지 측면에서 최적화될 수 있습니다.
- 이동 평균 변수를 최적화하여 전략 효과에 대한 다른 주기 변수의 영향을 테스트합니다.
- 브린라인 채널, KDJ 지표 등과 같은 다른 지표들을 추가하여 큰 트렌드를 판단합니다.
- 시장의 변화에 따라 동적으로 조정할 수 있도록 손해 방지 전략을 조정합니다.
- 입학 조건을 최적화하여 단기 조정으로 인한 잘못된 입학을 방지합니다.
다섯째, 요약
이 글은 가격과 200일 이동 평균의 거리에 기반한 트렌드 추적 전략의 원리, 장점, 위험 및 최적화 방향에 대해 자세히 분석한다. 이 전략은 가격과 장기 평균의 거리를 추적함으로써 중장기 트렌드 방향을 판단하고, 가격이 평균의 특정 하위치를 초과할 때 포지션 추적 트렌드를 설정하고, 퇴출 조건은 중지 또는 중지입니다. 이 전략은 중장기 가격 트렌드를 잘 추적하지만, 특정 변수 최적화 공간도 존재한다.
/*backtest
start: 2024-02-22 00:00:00
end: 2024-02-24 06:00:00
period: 3h
basePeriod: 15m
exchanges: [{"eid":"Futures_Binance","currency":"BTC_USDT"}]
*/

//@version=4
strategy("Intraday Price Away from 200 EMA Strategy", overlay=true)

// Define inputs
emaPeriod = input(200, title="EMA Period")
thresholdPercent = input(0.75, title="Threshold Percent", minval=0)  // Define the threshold percentage

// Calculate 200 EMA
ema = ema(close, emaPeriod)

// Calculate distance from 200 EMA as a percentage
distance_percent = ((close - ema) / ema) * 100

// Track average entry price
var float avgEntryPrice = na

// Buy conditions
buy_condition = close < ema and abs(distance_percent) >= thresholdPercent and close[1] < close[2]

// Exit conditions for buy
exit_buy_condition = close >= ema or time_close(timeframe.period) or (avgEntryPrice * 1.5) <= close

// Sell conditions
sell_condition = close > ema and abs(distance_percent) >= thresholdPercent and close[1] > close[2]

// Exit conditions for sell
exit_sell_condition = close <= ema or time_close(timeframe.period) or (avgEntryPrice * 1.5) >= close

// Execute buy and sell orders only if there are no open trades
if strategy.opentrades == 0
    strategy.entry("Buy", strategy.long, when=buy_condition)
    strategy.entry("Sell", strategy.short, when=sell_condition)

// Update average entry price for buy condition
if buy_condition
    avgEntryPrice := close

// Update average entry price for sell condition
if sell_condition
    avgEntryPrice := close

// Close buy position if exit condition is met
strategy.close("Buy", when=exit_buy_condition)

// Close sell position if exit condition is met
strategy.close("Sell", when=exit_sell_condition)

// Plot 200 EMA
plot(ema, color=color.blue, linewidth=2)

// Plot buy and sell signals
plotshape(buy_condition, style=shape.triangleup, location=location.belowbar, color=color.green, size=size.small)
plotshape(sell_condition, style=shape.triangledown, location=location.abovebar, color=color.red, size=size.small)