개요
가우시안 채널 트렌드 추적 전략은 가우시안 채널 지표에 기반한 트렌드 추적 거래 전략이다. 이 전략은 시장의 주요 트렌드를 포착하고, 상승하는 트렌드에서 구매하고 포지션을 보유하며, 하락하는 트렌드에서 평점을 관찰한다. 전략은 가우시안 채널 지표를 사용하여 트렌드의 방향과 강도를 식별하고, 가격과 채널 상하의 관계를 분석하여 구매 시점을 결정한다.
전략 원칙
가우시안 채널 트렌드 추적 전략의 핵심은 가우시안 채널 지표입니다. 이 지표는 Ehlers에 의해 제안되었으며, 가우시안 파동 기술과 실제 범위 ((True Range) 를 결합한 트렌드 분석 도구입니다. 지표는 먼저 샘플링 주기와 극점 수에 따라 β 및 α 값을 계산한 다음 데이터를 필터링하여 평준화 곡선을 얻습니다.
전략적 이점
- 트렌드 추적: 이 전략은 시장의 주요 트렌드를 포착하고, 트렌드 방향으로 투자하여 장기적으로 안정적인 수익을 얻을 수 있습니다.
- 거래 빈도를 줄여: 전략은 트렌드가 확인될 때만 입시하고, 트렌드가 지속되는 동안 지분을 유지하여 불필요한 거래 횟수와 거래 비용을 줄인다.
- 지연을 줄이십시오: 지연 모드와 신속한 반응 모드를 줄임으로써 전략은 시장 변화에 더 신속하게 반응 할 수 있습니다.
- 매개 변수 유연성: 사용자는 자신의 요구에 따라 매개 변수, 예를 들어 샘플 주기, 극점 수, 실제 범위 배수 등을 조정하여 매개 변수 성능을 최적화할 수 있다.
전략적 위험
- 파라미터 최적화 위험: 부적절한 파라미터 설정으로 인해 전략이 제대로 작동하지 않을 수 있습니다. 다양한 시장 환경에서 파라미터 최적화 및 피드백을 수행하여 최적의 파라미터 조합을 찾는 것이 좋습니다.
- 추세 전환 위험: 시장 추세가 급격히 변할 때, 전략은 큰 회전을 일으킬 수 있다. 스톱로스를 설정하거나 다른 지표를 도입하여 위험을 제어 할 수 있다.
- 흔들리는 시장 위험: 흔들리는 시장에서, 전략은 종종 거래 신호가 발생하여 수익을 손상시킬 수 있습니다. 최적화 매개 변수 또는 다른 기술 지표와 결합하여 신호를 필터링 할 수 있습니다.
전략 최적화 방향
- 다른 기술 지표 도입: 다른 트렌드 클래스 또는 흔들림 클래스 지표와 같은 MACD, RSI 등과 결합하여 신호의 정확성과 신뢰성을 향상시킵니다.
- 동적 매개 변수 최적화: 시장 상태의 변화에 따라 전략 매개 변수를 동적으로 조정하여 다른 시장 환경에 적응합니다.
- 리스크 컨트롤 모듈을 추가합니다. 합리적인 스톱 로즈 및 스톱 스톱 규칙을 설정하고, 단일 거래의 위험과 전체 철회 수준을 제어합니다.
- 다중 시간 프레임 분석: 더 포괄적 인 시장 정보를 얻기 위해 다른 시간 주기의 신호를 결합합니다.
요약하다
가우시안 채널 트렌드 추적 전략은 가우시안 파동 기술을 기반으로 한 트렌드 추적 거래 전략으로, 시장의 주요 트렌드를 포착하여 장기적으로 안정적인 수익을 얻습니다. 전략은 가우시안 채널 지표를 사용하여 트렌드 방향과 강도를 식별하고, 지연 및 신속한 반응을 줄이는 기능을 제공합니다. 전략의 장점은 좋은 트렌드 추적 능력과 낮은 거래 빈도입니다. 그러나 또한 변수 최적화, 트렌드 전환 및 흔들리는 시장과 같은 위험에 직면합니다.
전략 소스 코드
/*backtest
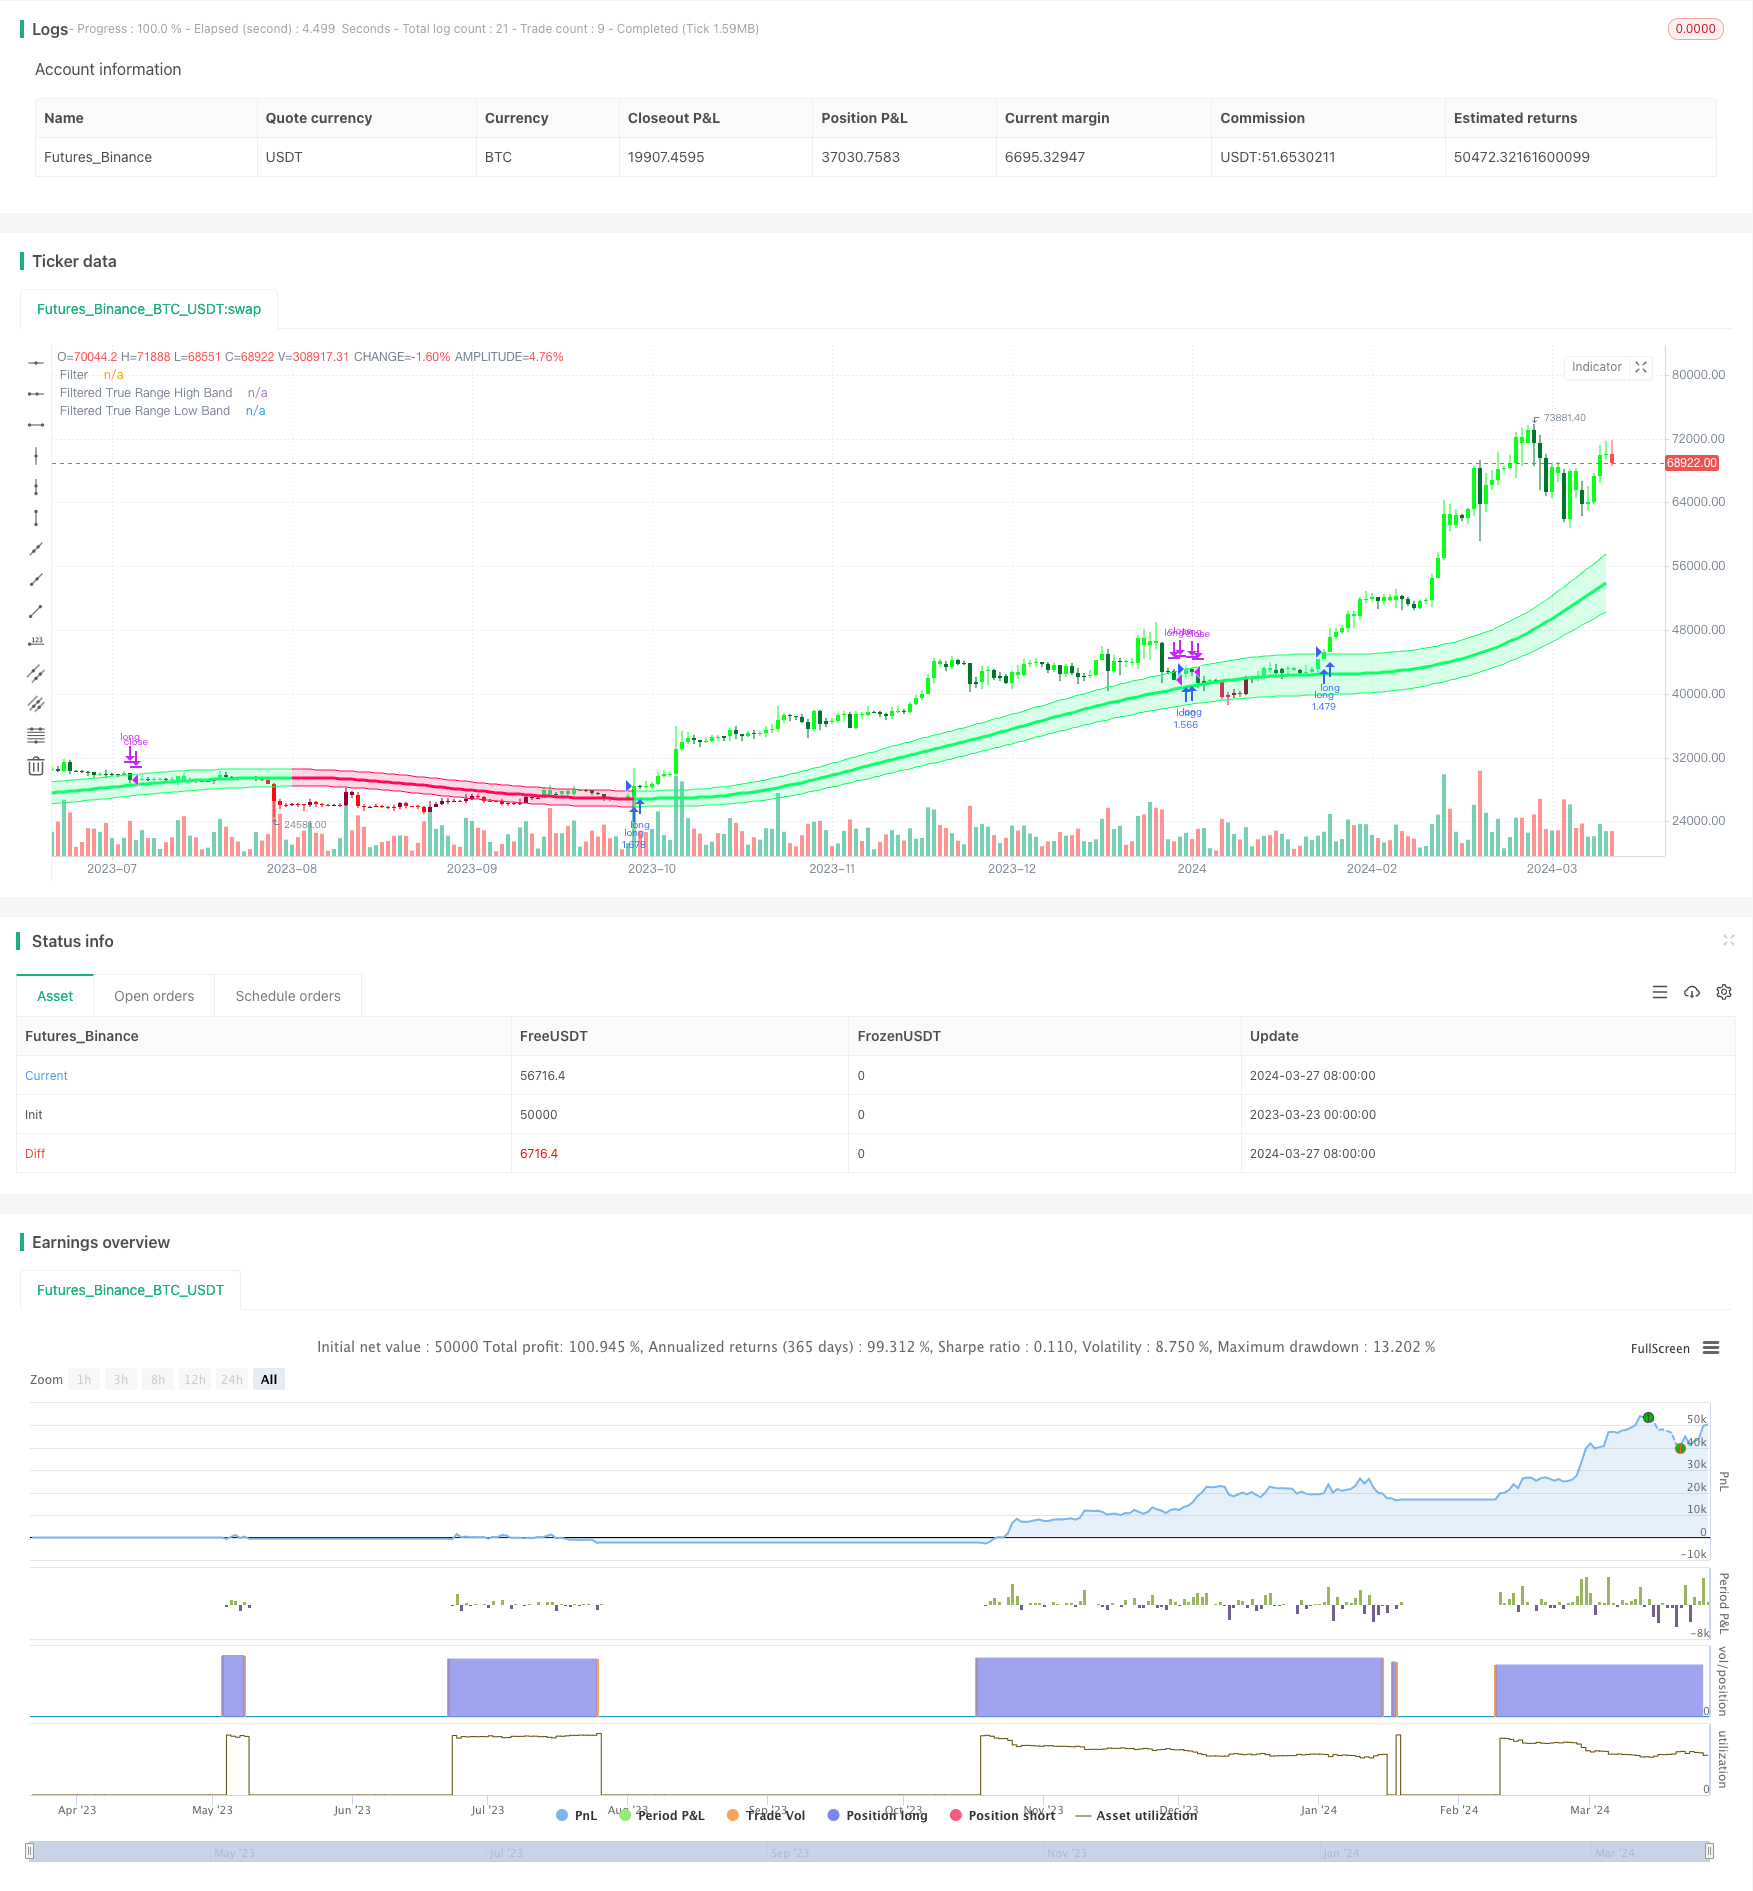
start: 2023-03-23 00:00:00
end: 2024-03-28 00:00:00
period: 1d
basePeriod: 1h
exchanges: [{"eid":"Futures_Binance","currency":"BTC_USDT"}]
*/
//@version=5
strategy(title="Gaussian Channel Strategy v2.0", overlay=true, calc_on_every_tick=false, initial_capital=1000, default_qty_type=strategy.percent_of_equity, default_qty_value=100, commission_type=strategy.commission.percent, commission_value=0.1, slippage=3)
//-----------------------------------------------------------------------------------------------------------------------------------------------------------------
// Gaussian Channel Indicaor - courtesy of @DonovanWall
//-----------------------------------------------------------------------------------------------------------------------------------------------------------------
// Date condition inputs
startDate = input(timestamp("1 January 2018 00:00 +0000"), "Date Start", group="Main Algo Settings")
endDate = input(timestamp("1 January 2060 00:00 +0000"), "Date Start", group="Main Algo Settings")
timeCondition = true
// This study is an experiment utilizing the Ehlers Gaussian Filter technique combined with lag reduction techniques and true range to analyze trend activity.
// Gaussian filters, as Ehlers explains it, are simply exponential moving averages applied multiple times.
// First, beta and alpha are calculated based on the sampling period and number of poles specified. The maximum number of poles available in this script is 9.
// Next, the data being analyzed is given a truncation option for reduced lag, which can be enabled with "Reduced Lag Mode".
// Then the alpha and source values are used to calculate the filter and filtered true range of the dataset.
// Filtered true range with a specified multiplier is then added to and subtracted from the filter, generating a channel.
// Lastly, a one pole filter with a N pole alpha is averaged with the filter to generate a faster filter, which can be enabled with "Fast Response Mode".
// Custom bar colors are included.
// Note: Both the sampling period and number of poles directly affect how much lag the indicator has, and how smooth the output is.
// Larger inputs will result in smoother outputs with increased lag, and smaller inputs will have noisier outputs with reduced lag.
// For the best results, I recommend not setting the sampling period any lower than the number of poles + 1. Going lower truncates the equation.
//-----------------------------------------------------------------------------------------------------------------------------------------------------------------
// Updates:
// Huge shoutout to @e2e4mfck for taking the time to improve the calculation method!
// -> migrated to v4
// -> pi is now calculated using trig identities rather than being explicitly defined.
// -> The filter calculations are now organized into functions rather than being individually defined.
// -> Revamped color scheme.
//-----------------------------------------------------------------------------------------------------------------------------------------------------------------
// Functions - courtesy of @e2e4mfck
//-----------------------------------------------------------------------------------------------------------------------------------------------------------------
// Filter function
f_filt9x (_a, _s, _i) =>
int _m2 = 0, int _m3 = 0, int _m4 = 0, int _m5 = 0, int _m6 = 0,
int _m7 = 0, int _m8 = 0, int _m9 = 0, float _f = .0, _x = (1 - _a)
// Weights.
// Initial weight _m1 is a pole number and equal to _i
_m2 := _i == 9 ? 36 : _i == 8 ? 28 : _i == 7 ? 21 : _i == 6 ? 15 : _i == 5 ? 10 : _i == 4 ? 6 : _i == 3 ? 3 : _i == 2 ? 1 : 0
_m3 := _i == 9 ? 84 : _i == 8 ? 56 : _i == 7 ? 35 : _i == 6 ? 20 : _i == 5 ? 10 : _i == 4 ? 4 : _i == 3 ? 1 : 0
_m4 := _i == 9 ? 126 : _i == 8 ? 70 : _i == 7 ? 35 : _i == 6 ? 15 : _i == 5 ? 5 : _i == 4 ? 1 : 0
_m5 := _i == 9 ? 126 : _i == 8 ? 56 : _i == 7 ? 21 : _i == 6 ? 6 : _i == 5 ? 1 : 0
_m6 := _i == 9 ? 84 : _i == 8 ? 28 : _i == 7 ? 7 : _i == 6 ? 1 : 0
_m7 := _i == 9 ? 36 : _i == 8 ? 8 : _i == 7 ? 1 : 0
_m8 := _i == 9 ? 9 : _i == 8 ? 1 : 0
_m9 := _i == 9 ? 1 : 0
// filter
_f := math.pow(_a, _i) * nz(_s) +
_i * _x * nz(_f[1]) - (_i >= 2 ?
_m2 * math.pow(_x, 2) * nz(_f[2]) : 0) + (_i >= 3 ?
_m3 * math.pow(_x, 3) * nz(_f[3]) : 0) - (_i >= 4 ?
_m4 * math.pow(_x, 4) * nz(_f[4]) : 0) + (_i >= 5 ?
_m5 * math.pow(_x, 5) * nz(_f[5]) : 0) - (_i >= 6 ?
_m6 * math.pow(_x, 6) * nz(_f[6]) : 0) + (_i >= 7 ?
_m7 * math.pow(_x, 7) * nz(_f[7]) : 0) - (_i >= 8 ?
_m8 * math.pow(_x, 8) * nz(_f[8]) : 0) + (_i == 9 ?
_m9 * math.pow(_x, 9) * nz(_f[9]) : 0)
// 9 var declaration fun
f_pole (_a, _s, _i) =>
_f1 = f_filt9x(_a, _s, 1), _f2 = (_i >= 2 ? f_filt9x(_a, _s, 2) : 0), _f3 = (_i >= 3 ? f_filt9x(_a, _s, 3) : 0)
_f4 = (_i >= 4 ? f_filt9x(_a, _s, 4) : 0), _f5 = (_i >= 5 ? f_filt9x(_a, _s, 5) : 0), _f6 = (_i >= 6 ? f_filt9x(_a, _s, 6) : 0)
_f7 = (_i >= 2 ? f_filt9x(_a, _s, 7) : 0), _f8 = (_i >= 8 ? f_filt9x(_a, _s, 8) : 0), _f9 = (_i == 9 ? f_filt9x(_a, _s, 9) : 0)
_fn = _i == 1 ? _f1 : _i == 2 ? _f2 : _i == 3 ? _f3 :
_i == 4 ? _f4 : _i == 5 ? _f5 : _i == 6 ? _f6 :
_i == 7 ? _f7 : _i == 8 ? _f8 : _i == 9 ? _f9 : na
[_fn, _f1]
//-----------------------------------------------------------------------------------------------------------------------------------------------------------------
// Inputs
//-----------------------------------------------------------------------------------------------------------------------------------------------------------------
// Source
src = input(defval=hlc3, title="Source")
// Poles
int N = input.int(defval=4, title="Poles", minval=1, maxval=9)
// Period
int per = input.int(defval=144, title="Sampling Period", minval=2)
// True Range Multiplier
float mult = input.float(defval=1.414, title="Filtered True Range Multiplier", minval=0)
// Lag Reduction
bool modeLag = input.bool(defval=false, title="Reduced Lag Mode")
bool modeFast = input.bool(defval=false, title="Fast Response Mode")
//-----------------------------------------------------------------------------------------------------------------------------------------------------------------
// Definitions
//-----------------------------------------------------------------------------------------------------------------------------------------------------------------
// Beta and Alpha Components
beta = (1 - math.cos(4*math.asin(1)/per)) / (math.pow(1.414, 2/N) - 1)
alpha = - beta + math.sqrt(math.pow(beta, 2) + 2*beta)
// Lag
lag = (per - 1)/(2*N)
// Data
srcdata = modeLag ? src + (src - src[lag]) : src
trdata = modeLag ? ta.tr(true) + (ta.tr(true) - ta.tr(true)[lag]) : ta.tr(true)
// Filtered Values
[filtn, filt1] = f_pole(alpha, srcdata, N)
[filtntr, filt1tr] = f_pole(alpha, trdata, N)
// Lag Reduction
filt = modeFast ? (filtn + filt1)/2 : filtn
filttr = modeFast ? (filtntr + filt1tr)/2 : filtntr
// Bands
hband = filt + filttr*mult
lband = filt - filttr*mult
// Colors
color1 = #0aff68
color2 = #00752d
color3 = #ff0a5a
color4 = #990032
fcolor = filt > filt[1] ? #0aff68 : filt < filt[1] ? #ff0a5a : #cccccc
barcolor = (src > src[1]) and (src > filt) and (src < hband) ? #0aff68 : (src > src[1]) and (src >= hband) ? #0aff1b : (src <= src[1]) and (src > filt) ? #00752d :
(src < src[1]) and (src < filt) and (src > lband) ? #ff0a5a : (src < src[1]) and (src <= lband) ? #ff0a11 : (src >= src[1]) and (src < filt) ? #990032 : #cccccc
//-----------------------------------------------------------------------------------------------------------------------------------------------------------------
// Outputs
//-----------------------------------------------------------------------------------------------------------------------------------------------------------------
// Filter Plot
filtplot = plot(filt, title="Filter", color=fcolor, linewidth=3)
// Band Plots
hbandplot = plot(hband, title="Filtered True Range High Band", color=fcolor)
lbandplot = plot(lband, title="Filtered True Range Low Band", color=fcolor)
// Channel Fill
fill(hbandplot, lbandplot, title="Channel Fill", color=color.new(fcolor, 80))
// Bar Color
barcolor(barcolor)
longCondition = ta.crossover(close, hband) and timeCondition
closeAllCondition = ta.crossunder(close, hband) and timeCondition
if longCondition
strategy.entry("long", strategy.long)
if closeAllCondition
strategy.close("long")