3EMA + Boullinger + PIVOT
Penulis:ChaoZhang, Tarikh: 2022-05-08 12:22:57Tag:EMA
Tiga EMAS + BOLLINGER BAND + PIVOT
INDIKATOR 1: Tiga EMAS (PERATAN bergerak eksponen) Dengan penunjuk ini anda boleh memvisualisasikan purata harga dengan berat yang lebih besar kepada data yang paling terkini. Tiga purata bergerak eksponensial dikira dan digambar: 4, 20 dan 200 lilin terakhir. - Fast EMA1 = 8 - purata EMA2 = 20 - EMA perlahan 3 = 200
Indikator 2: BOLLINGER BONDS Dengan penunjuk ini anda boleh melihat kekuatan dan trend pasaran, iaitu, ia diukur dengan turun naik harga aset. Jika harga melebihi band atas, aset itu overbought. Jika harga melebihi band bawah, aset itu terlalu dijual. Panjang trend - BASE = 20, langkah = 1 Penyimpangan standard - Pengganda = 2, langkah = 0.2
Indikator 3: PIVOT
Penunjuk ini memberi label titik di mana harga adalah minimum dan maksimum, dalam julat lilin yang ditentukan dalam parameter
Tiga penunjuk ini digunakan untuk semua jenis aset: FOREX, CRYPT, CFD
Ujian belakang
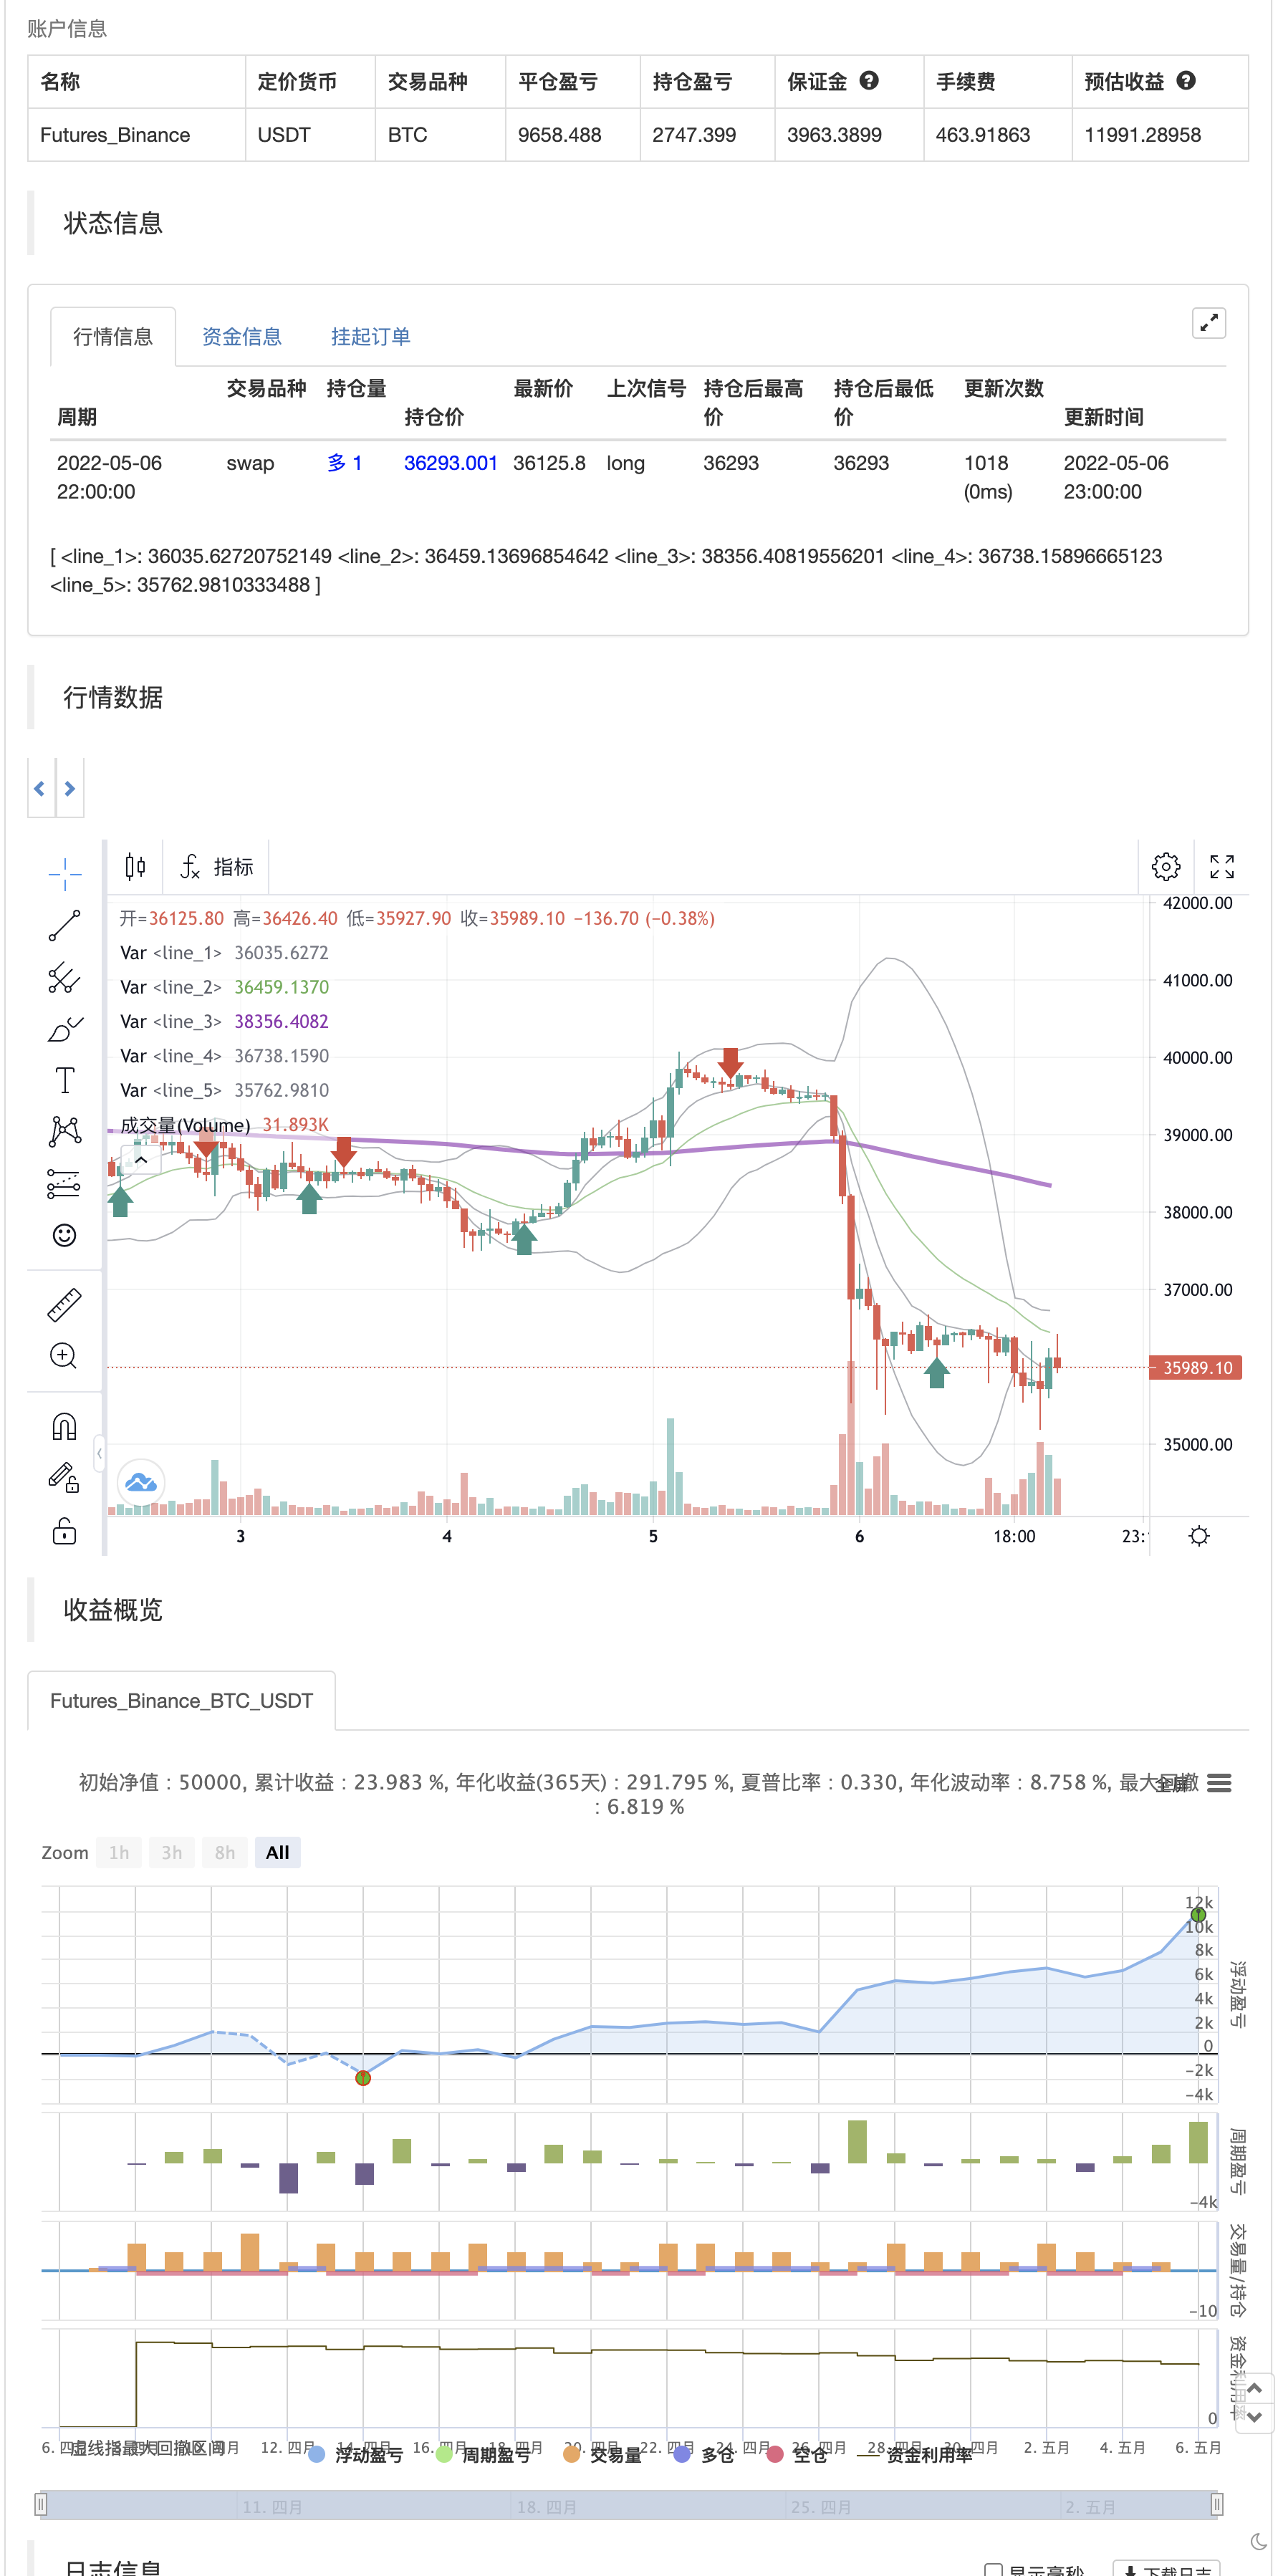
/*backtest
start: 2022-04-07 00:00:00
end: 2022-05-06 23:59:00
period: 1h
basePeriod: 15m
exchanges: [{"eid":"Futures_Binance","currency":"BTC_USDT"}]
*/

// This source code is subject to the terms of the Mozilla Public License 2.0 at https://mozilla.org/MPL/2.0/
// © JCMR76

//@version=4
study("3EMA + Boullinger + PIVOT", overlay=true)


// TRES EMAS - THREE EMA´s
periodo1 = input(8, title="Periodo 1, Length 1=", step =1, minval=1, maxval=300)
periodo2 = input(20, title="Periodo 2, Length 2=", step =1, minval=1, maxval=300)
periodo3 = input(200, title="Periodo 3, Length 3=", step =1, minval=1, maxval=1000)


plot(ema(close,periodo1), color=color.gray, linewidth=1)
plot(ema(close,periodo2), color=color.green, linewidth=1)
plot(ema(close,periodo3), color=color.purple, linewidth=3)

//BANDA BOLLINGER - BANDS BOLLINGER
longitudbb   = input(20,title = "longitudBB, LenghtBB=", type = input.integer, step = 1, minval=1, maxval=50)
multbb       = input(2.0, title = "Multiplicadorbb, EstDesv = ", type= input.float, step = 0.2, minval=0.2, maxval=20)
fuente       = input(close, title="fuente", type=input.source)
[mm,banda_sup, banda_inf] = bb(fuente, longitudbb,multbb)
ps=plot(banda_sup, color=color.new(color.gray, 90))
pi=plot(banda_inf, color=color.new(color.gray, 90))
//fill(ps,pi,color=color.new(color.gray,80))

//PIVOT - PIVOTE
dist = input(6, title ="distancia para el pivote/ distance to pivot ", type = input.integer, step = 1)

pl = pivotlow(low, dist, dist)
if not na(pl)
    strategy.entry("Enter Long", strategy.long)

ph = pivothigh(high, dist, dist)
if not na(ph)
    strategy.entry("Enter Short", strategy.short)
//PIVOT - PIVOTE
- Strategi Dagangan Berdasarkan Persaingan Emas dan Kematian MACD Berturut-turut
- Strategi Perdagangan RSI Bollinger Bands yang Dipertingkatkan
- Strategi Crossover EMA Bertiga
- Strategi Leverage Crossover Purata Bergerak Eksponen
- Strategi purata bergerak berganda GM-8 & ADX
- Strategi silang EMA yang dipertingkatkan dengan RSI/MACD/ATR
- Trend Z-Score Mengikut Strategi
- Pendaftaran panjang pada EMA Bersilang dengan Strategi Pengurusan Risiko
- Strategi Perdagangan VWAP
- Strategi WaveTrend Cross LazyBear
- Strategi Perdagangan AlphaTradingBot
- Ichimoku Cloud Smooth Oscillator
- Williams %R - Dihaluskan
- QQE MOD + SSL Hibrid + Ledakan Waddah Attar
- Beli / Jual Strat
- Triple Supertrend dengan EMA dan ADX
- Tom DeMark Peta Panas Berurutan
- jma + dwma oleh multigrain
- MAGIC MACD
- Z Skor dengan Isyarat
- Rancangan kadar turun naik mudah untuk bahasa Pine
- baguette oleh multigrain
- MillMachine
- Indikator Pembalikan K I
- Lilin yang Menelan
- MA Maharaja Insiliconot
- Titik Pembalikan Demark
- Swing Highs/Lows & corak lilin
- TMA Overlay
- Strategi MACD + SMA 200
- Sistem CM Sling Shot