RSI - Isyarat Beli Jual
Penulis:ChaoZhang, Tarikh: 2022-05-09 14:35:23Tag:RSI
Indikator ini terutamanya berdasarkan Overbought dan Oversold. Indikator untuk perdagangan jangka pendek. Dengan cara ini anda boleh mendapatkan isyarat kecil tetapi boleh diterima. Asas utama penunjuk adalah seperti berikut: Untuk membeli, penunjuk itu menunggu instrumen itu dijual terlalu banyak dari sudut RSI. Kemudian, jika carta melintasi garis bawah penunjuk Envelope dari bawah ke atas, isyarat beli dikeluarkan. Untuk menjual, penunjuk menunggu instrumen untuk overbought dari perspektif RSI. Kemudian, jika carta melintasi garis atas penunjuk Envelope dari atas ke bawah, isyarat jual dikeluarkan. Asas umum adalah keserasian harga dan penunjuk RSI. Pengaturan terbaik saya datang dengan diri saya sendiri: Jangka masa: 15 minit Dibeli lebih banyak: 80 Jualan: 25 RSI Panjang: 8 Ia boleh dilakukan pada instrumen yang berbeza, tetapi sentiasa menetapkan had keuntungan dan kerugian anda. (Rasio keuntungan ke kerugian dalam penunjuk ini boleh menjadi 1: 1.)
Penafian: Maklumat dan penunjuk perdagangan dan alat yang disediakan ini tidak, dan tidak boleh ditafsirkan, sebagai tawaran, atau permintaan tawaran, untuk membeli atau menjual sekuriti. Saya tidak bertanggungjawab atas apa-apa keuntungan, peningkatan kewangan, kerugian atau kerosakan, kewangan atau lain-lain yang mungkin disebabkan oleh penerapan maklumat yang terkandung dalam penunjuk ini.
Ujian belakang
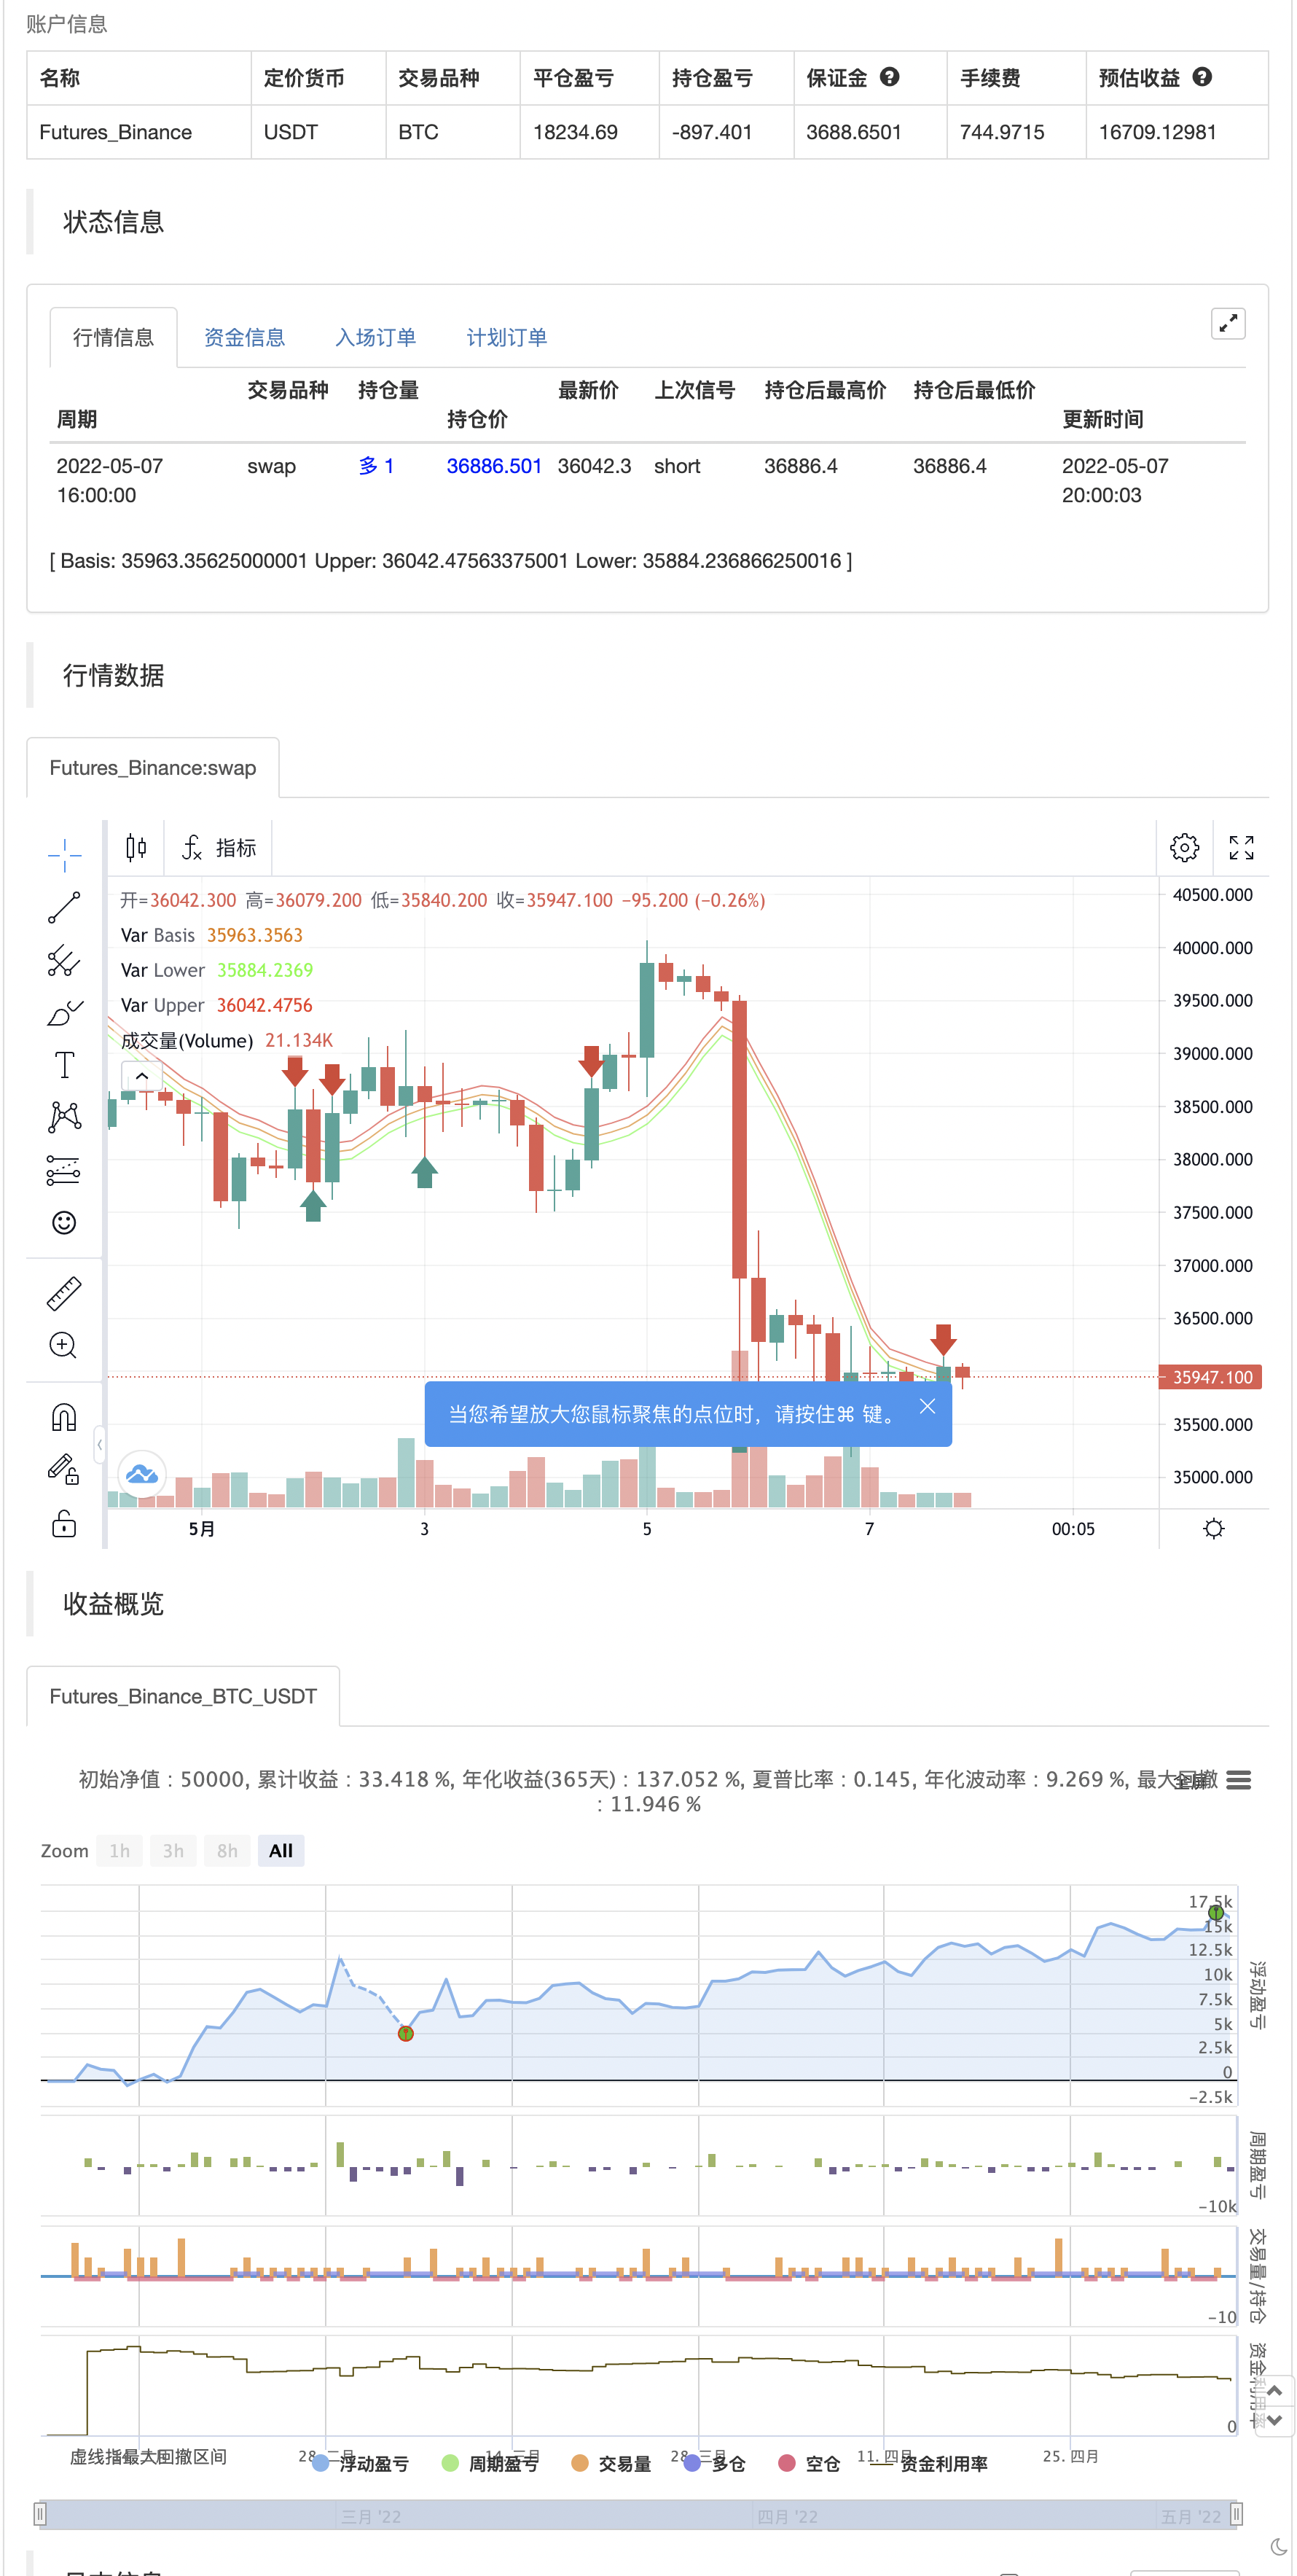
/*backtest
start: 2022-02-08 00:00:00
end: 2022-05-08 00:00:00
period: 4h
basePeriod: 15m
exchanges: [{"eid":"Futures_Binance","currency":"BTC_USDT"}]
*/

// This source code is subject to the terms of the Mozilla Public License 2.0 at https://mozilla.org/MPL/2.0/
// © Saleh_Toodarvari

//@version=5
indicator(title="ENVELOPE - RSI - Buy Sell Signals", shorttitle="ENVELOPE - RSI", overlay=true)
//_________________Envelope_________________
len = input.int(8, title="Envelope Length", minval=1, group="Envelope Settings")
percent = input(0.22,title="Envelope Percent", group="Envelope Settings")
src = input(hl2, title="Envelope Source", group="Envelope Settings")
exponential = input(false)
basis = exponential ? ta.ema(src, len) : ta.sma(src, len)
k = percent/100.0
upper = basis * (1 + k)
lower = basis * (1 - k)
plot(basis, "Basis", color=#ED7300)
u = plot(upper, "Upper", color=#FF2424)
l = plot(lower, "Lower", color=#24FF24)
//fill(u, l, color=color.rgb(33, 150, 243, 95), title="Background")
cross_buy=ta.crossover(close,lower)
cross_sell=ta.crossunder(close,upper)
// _________________RSI_________________
rsiLengthInput = input.int(8, minval=1, title="RSI Length", group="RSI Settings")
rsiSourceInput = input.source(hl2, "RSI Source", group="RSI Settings")
up = ta.rma(math.max(ta.change(rsiSourceInput), 0), rsiLengthInput)
down = ta.rma(-math.min(ta.change(rsiSourceInput), 0), rsiLengthInput)
rsi = down == 0 ? 100 : up == 0 ? 0 : 100 - (100 / (1 + up / down))
Overbought_RSI = input(title="RSI OverBought Limit(Recommended: 70-85)", defval=80, group="RSI Settings")
Oversold_RSI = input(title="RSI OverSold Limit(Recommended: 20-30)", defval=25, group="RSI Settings")
condition_buy= rsi<Oversold_RSI and (ta.cross(low,lower) or ta.cross(close,lower) or ta.cross(high,lower) or ta.cross(open,lower))
condition_sell= rsi>Overbought_RSI and (ta.cross(low,upper) or ta.cross(close,upper) or ta.cross(high,upper) or ta.cross(open,upper))
if cross_sell
    strategy.entry("Enter Long", strategy.long)
else if cross_buy
    strategy.entry("Enter Short", strategy.short)

// plotshape(cross_sell ? condition_sell:na, title="Sell Label", text="Sell", location=location.abovebar, style=shape.labeldown, size=size.tiny, color=color.red, textcolor=color.white)
// sell_sig=plot(cross_sell ? high:na,color=color.new(#000000,100))
// plotshape(cross_buy ? condition_buy:na, title="Buy Label", text="Buy", location=location.belowbar, style=shape.labelup, size=size.tiny, color=color.green, textcolor=color.white)
// buy_sig=plot(cross_buy ? ohlc4:na,color=color.new(#000000,100))
// tpColor = if(cross_sell[1] or cross_sell[2] or cross_buy[1] or cross_buy[2])
//     color.new(#1DBC60, 30)
// else
//     color.new(#000000,100)
// slColor = if(cross_sell[1] or cross_sell[2] or cross_buy[1] or cross_buy[2])
//     color.new(#F74A58, 30)
// else
//     color.new(#000000,100)
// //_________________TP&SL_________________
// TP_Percent = input.float(0.15, "TP %")
// SL_Percent = input.float(0.15, "SL %")
// tp= if condition_sell
//     ohlc4-ohlc4*(TP_Percent/100)
// else if condition_buy
//     ohlc4+ohlc4*(TP_Percent/100)
// sl= if condition_sell
//     ohlc4+ohlc4*(SL_Percent/100)
// else if condition_buy
//     ohlc4-ohlc4*(SL_Percent/100)
// tp_sig=plot(tp,color=color.new(#000000,100),title="tp")
// sl_sig=plot(sl,color=color.new(#000000,100),title="tp")
// lower_plot=plot(lower,color=color.new(#000000,100))
// fill(sell_sig,tp_sig, color=tpColor)
// fill(buy_sig,tp_sig, color=tpColor)
// fill(buy_sig,sl_sig, color=slColor)
// fill(sell_sig,sl_sig, color=slColor)
- MACD RSI Ichimoku Trend Momentum Berikutan Strategi Panjang
- Strategi Perubahan Arah RSI
- Strategi Perdagangan RSI Bollinger Bands yang Dipertingkatkan
- Strategi Pivot dan Momentum
- Strategi Dagangan Komprehensif Purata Bergerak dan RSI
- Strategi Kembalikan Selasa (Filter hujung minggu)
- Strategi silang EMA yang dipertingkatkan dengan RSI/MACD/ATR
- Strategi Dagangan Jangka Panjang Bersama MACD dan RSI
- RSI2 Strategi Peralihan Intraday Win Rate Backtest
- Trend Multi-Indikator Mengikut Strategi
- Strategi Perdagangan AlphaTradingBot
- Midas Mk. II - Ultimate Crypto Swing
- TMA-Legacy
- Strategi TV Tinggi dan Rendah
- Strategi TradingView Terbaik
- Amaran Big Snapper R3.0 + Keadaan Volatiliti Chaiking + TP RSI
- Chande Kroll Hentikan
- CCI + EMA dengan RSI Cross Strategy
- EMA bands + leledc + bollinger bands trend catching strategi
- RSI MTF Ob+Os
- Strategi MACD Willy
- Trend Heikin-Ashi
- HA Kecenderungan Pasaran
- Ichimoku Cloud Smooth Oscillator
- Williams %R - Dihaluskan
- QQE MOD + SSL Hibrid + Ledakan Waddah Attar
- Beli / Jual Strat
- Triple Supertrend dengan EMA dan ADX
- Tom DeMark Peta Panas Berurutan
- jma + dwma oleh multigrain
- MAGIC MACD