Laraskan strategi penurunan dan beli


Tarikh penciptaan: 2023-10-24 14:14:00 Akhirnya diubah suai: 2023-10-24 14:14:00
Salin: 0 Bilangan klik: 735
1
fokus pada
1617
Pengikut

Laraskan strategi penurunan dan beli

Gambaran keseluruhan

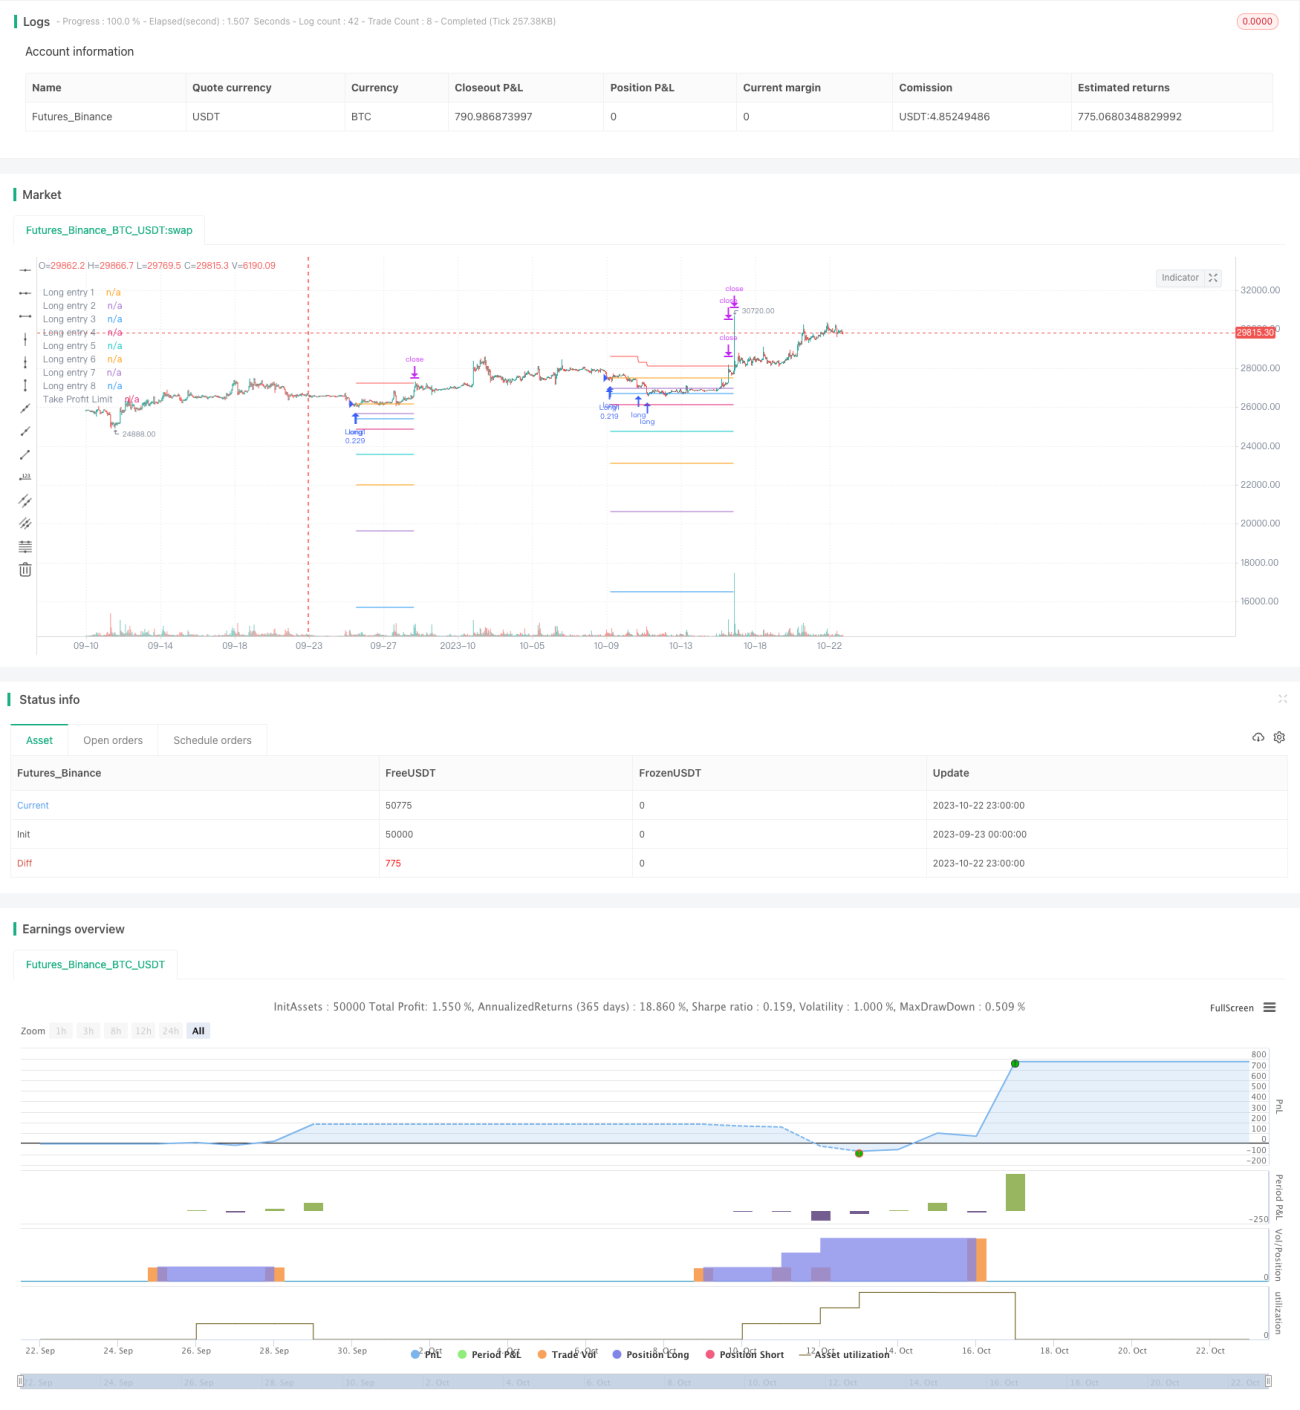
Strategi ini menggunakan kombinasi RSI dan harga rata-rata untuk mencari peluang menjual lebih banyak apabila harga saham jatuh di bawah garis rata-rata. Apabila harga saham jatuh lebih jauh, strategi ini akan meningkatkan kedudukan secara beransur-ansur mengikut peratusan yang ditetapkan untuk mencapai tujuan kos memegang kedudukan purata.

Prinsip Strategi

  1. Apabila RSI berada di bawah 29 dan harga penutupan berada di bawah garis purata, anda boleh membuat lebih banyak pesanan pertama.

  2. Apabila harga saham mencapai 2% dari penurunan pertama, lebih banyak pertaruhan dilakukan; apabila penurunan mencapai 3%, pertaruhan ketiga, dan seterusnya sehingga maksimum 8 kali pertaruhan. Ini mewujudkan kesan pembinaan pertaruhan secara berturut-turut.

  3. Setiap kali kedudukan dibuka, harga dibuka pada masa itu akan direkodkan. Titik harga ini adalah harga rujukan untuk masuk. Dan garis harga ini akan digambarkan pada carta.

  4. Selepas membuka kedudukan, harga purata kedudukan akan dikira. Dengan 3% daripada harga purata sebagai harga berhenti untuk setiap kedudukan, 4% sebagai harga berhenti untuk keseluruhan kedudukan.

  5. Apabila harga naik melebihi harga hentian untuk kedudukan tertentu, ia akan memilih untuk meletakkan kedudukan tersebut.

  6. Kaedah pengiraan penghentian beransur-ansur: setiap kedudukan yang dipadamkan, keuntungan yang dicapai oleh kedudukan itu akan ditolak dari harga penghentian keseluruhan. Ini dapat membuat garis penghentian bergerak perlahan ke bawah, dan hanya apabila keuntungan semua kedudukan cukup untuk menutup kerugian maksimum, semuanya akan berhenti.

  7. Apabila harga mencetuskan garis hentikan beransur-ansur, pilih posisi kosong sepenuhnya.

Analisis kelebihan

  1. Indeks RSI lebih tepat dalam menentukan kawasan oversold, yang membantu untuk merebut peluang untuk berbalik.

  2. Berkali-kali batch menambah simpanan, anda boleh purata kos simpanan pada titik rendah.

  3. Hentikan secara beransur-ansur dapat mengurangkan risiko kerugian dan mencapai pengeluaran secara beransur-ansur. Walaupun kerugian dapat dikawal dalam beberapa tahap.

  4. Rasio penangguhan dan rasio kenaikan kedudukan yang boleh dikonfigurasi, boleh disesuaikan dengan risiko strategi pasaran.

  5. Garis rujukan bukaan dan penutupan di dalam carta menunjukkan peredaran kedudukan secara intuitif.

Analisis risiko

  1. Dalam keadaan yang bergolak, mungkin beberapa kali mencetuskan kedudukan terbuka dan berhenti, perdagangan sering menyebabkan kerugian titik slippage. Parameter RSI boleh dilonggarkan dengan sewajarnya, mengurangkan bilangan dagangan.

  2. Penetapan yang tidak betul mengenai bilangan dan perkadaran deposit boleh menyebabkan perdagangan yang berlebihan, dan ia harus disusun dengan berhati-hati mengikut keadaan dana.

  3. Jika pasaran terus turun, risiko terowong tidak dapat diatasi. Anda harus menetapkan had maksimum untuk jumlah kenaikan, dan kadar kenaikan terakhir adalah konservatif.

  4. Jika nisbah penangguhan ditetapkan terlalu kecil, ia boleh menyebabkan penangguhan terlalu awal. Nisbah penangguhan yang sesuai harus ditetapkan berdasarkan data retest sejarah.

Arah pengoptimuman

  1. Indikator seperti MACD boleh diperkenalkan untuk menapis isyarat RSI, mengurangkan perdagangan tidak sah.

  2. Anda boleh menetapkan Hentian Kerosakan (ATR) untuk mengelakkan kerugian besar yang disebabkan oleh keadaan yang melampau.

  3. Anda boleh mengoptimumkan parameter seperti bilangan kenaikan saham, nisbah, nisbah penangguhan, dan lain-lain untuk membuat strategi lebih sesuai dengan pelbagai jenis.

  4. Rasio penangguhan boleh diselaraskan secara pintar mengikut kadar lonjakan, dan dilepaskan dengan sewajarnya apabila lonjakan besar.

ringkaskan

Strategi ini memanfaatkan sepenuhnya indikator RSI untuk menentukan kawasan oversold, dan berurusan dengan harga rata-rata untuk bertukar balik. Pada masa yang sama, menggunakan mekanisme penambahan simpanan pintar dan hentian beransur-ansur, dalam keadaan mengawal risiko, untuk mencapai pelbagai strategi yang sangat berkesan. Dengan mengoptimumkan parameter indikator, mekanisme hentian, dan lain-lain, anda boleh menjadikan strategi lebih stabil dan lebih berkesan.

Kod sumber strategi
/*backtest
start: 2023-09-23 00:00:00
end: 2023-10-23 00:00:00
period: 1h
basePeriod: 15m
exchanges: [{"eid":"Futures_Binance","currency":"BTC_USDT"}]
*/

// This source code is subject to the terms of the Mozilla Public License 2.0 at https://mozilla.org/MPL/2.0/
//@version=5
// © A3Sh

// RSI Strategy that buys the dips, uses Price Averaging and Pyramiding.
// When the price drops below specified percentages of the price (8 PA layers), new entries are openend to average the price of the assets.
// Open entries are closed by a specified take profit.
// Entries can be reopened, after closing and consequently crossing a PA layer again.
// This strategy is based on the RSI+PA+DCA strategy I created earlier. The difference is the way the Take Profit is calculated.
// Instead of directly connecting the take profit limit to the decreasing average price level with an X percent above the average price, 
// the take profit is calculated for a part on the decreasing average price and for another part on the deduction 
// of the profits of the individual closed positions.
// The Take Profit Limit drop less significant then the average price level and the full position only completely exits 
// when enough individual closed positions made up for the losses.
// This makes it less risky and more conservative and great for a long term trading strategy
// RSI code is adapted from the build in Relative Strength Index indicator
// MA Filter and RSI concept adapted from the Optimized RSI Buy the Dips strategy, by Coinrule
// https://www.tradingview.com/script/Pm1WAtyI-Optimized-RSI-Strategy-Buy-The-Dips-by-Coinrule/
// Pyramiding entries code adapted from Pyramiding Entries on Early Trends startegy, by Coinrule
// https://www.tradingview.com/script/7NNJ0sXB-Pyramiding-Entries-On-Early-Trends-by-Coinrule/
// Plot entry layers code adapted from HOWTO Plot Entry Price by vitvlkv
// https://www.tradingview.com/script/bHTnipgY-HOWTO-Plot-Entry-Price/


strategy(title='RSI+PA+PTP', pyramiding=16, overlay=true, initial_capital=400, default_qty_type=strategy.percent_of_equity, default_qty_value=15, commission_type=strategy.commission.percent, commission_value=0.075, close_entries_rule='FIFO')

port = input.float(12, group = "Risk", title='Portfolio % Used To Open The 8 Positions', step=0.1, minval=0.1, maxval=100)
q    = strategy.equity / 100 * port / open


// Long position PA entry layers. Percentage from the entry price of the the first long
ps2 = input.float(2,  group = "Long Position Entry Layers", title='2nd Long Entry %', step=0.1)
ps3 = input.float(3,  group = "Long Position Entry Layers", title='3rd Long Entry %', step=0.1)
ps4 = input.float(5,  group = "Long Position Entry Layers", title='4th Long Entry %', step=0.1)
ps5 = input.float(10, group = "Long Position Entry Layers", title='5th Long Entry %', step=0.1)
ps6 = input.float(16, group = "Long Position Entry Layers", title='6th Long Entry %', step=0.1)
ps7 = input.float(25, group = "Long Position Entry Layers" ,title='7th Long Entry %', step=0.1)
ps8 = input.float(40, group = "Long Position Entry Layers", title='8th Long Entry %', step=0.1)


// Calculate Moving Averages
plotMA               = input.bool(group = "Moving Average Filter", title='Plot Moving Average', defval=false)
movingaverage_signal = ta.sma(close, input(100, group = "Moving Average Filter", title='MA Length'))

plot (plotMA ? movingaverage_signal : na, color = color.new (color.green, 0))


// RSI inputs and calculations
rsiLengthInput = input.int(14, minval=1, title="RSI Length", group="RSI Settings")
rsiSourceInput = input.source(close, "Source", group="RSI Settings")

up   = ta.rma(math.max(ta.change(rsiSourceInput), 0), rsiLengthInput)
down = ta.rma(-math.min(ta.change(rsiSourceInput), 0), rsiLengthInput)
rsi  = down == 0 ? 100 : up == 0 ? 0 : 100 - (100 / (1 + up / down))

overSold = input.int(29, title="Oversold, Trigger to Enter First Position", group = "RSI Settings")

// Long trigger (co)
co = ta.crossover(rsi, overSold) and close < movingaverage_signal


// Store values to create and plot the different PA layers
long1 = ta.valuewhen(co, close, 0)
long2 = ta.valuewhen(co, close - close / 100 * ps2, 0)
long3 = ta.valuewhen(co, close - close / 100 * ps3, 0)
long4 = ta.valuewhen(co, close - close / 100 * ps4, 0)
long5 = ta.valuewhen(co, close - close / 100 * ps5, 0)
long6 = ta.valuewhen(co, close - close / 100 * ps6, 0)
long7 = ta.valuewhen(co, close - close / 100 * ps7, 0)
long8 = ta.valuewhen(co, close - close / 100 * ps8, 0)

eps1 = 0.00
eps1 := na(eps1[1]) ? na : eps1[1]

eps2 = 0.00
eps2 := na(eps2[1]) ? na : eps2[1]

eps3 = 0.00
eps3 := na(eps3[1]) ? na : eps3[1]

eps4 = 0.00
eps4 := na(eps4[1]) ? na : eps4[1]

eps5 = 0.00
eps5 := na(eps5[1]) ? na : eps5[1]

eps6 = 0.00
eps6 := na(eps6[1]) ? na : eps6[1]

eps7 = 0.00
eps7 := na(eps7[1]) ? na : eps7[1]

eps8 = 0.00
eps8 := na(eps8[1]) ? na : eps8[1]

plot(strategy.position_size > 0 ? eps1 : na, title='Long entry 1', style=plot.style_linebr)
plot(strategy.position_size > 0 ? eps2 : na, title='Long entry 2', style=plot.style_linebr)
plot(strategy.position_size > 0 ? eps3 : na, title='Long entry 3', style=plot.style_linebr)
plot(strategy.position_size > 0 ? eps4 : na, title='Long entry 4', style=plot.style_linebr)
plot(strategy.position_size > 0 ? eps5 : na, title='Long entry 5', style=plot.style_linebr)
plot(strategy.position_size > 0 ? eps6 : na, title='Long entry 6', style=plot.style_linebr)
plot(strategy.position_size > 0 ? eps7 : na, title='Long entry 7', style=plot.style_linebr)
plot(strategy.position_size > 0 ? eps8 : na, title='Long entry 8', style=plot.style_linebr)


// Take Profit Settings
ProfitTarget_Percent     = input.float(3.0,   group = "Take Profit Settings", title='Take Profit % (Per Position)')
ProfitTarget_Percent_All = input.float(4.0,   group = "Take Profit Settings", title='Take Profit % (Exit All, Progressive Take Profit Limit')
TakeProfitProgression    = input.float(12,    group = "Take Profit Settings", title='Take Profit Progression', tooltip = 'Progression is defined by the position size. By default 12% of the start equity (portfolio) is used to open a position, see Risk. This same % percentage is used to calculate the profit amount that will be deducted from the Take Profit Limit.')
entryOn                  = input.bool (true,  group = "Take Profit Settings", title='New entries affect Take Profit limit', tooltip = 'This option changes the behaviour of the Progressive Take Profit. When switchted on, the difference between the former and current original Take Profit is deducted from the Progressive Take Profit. When switchted off, the Progressive Take Profit is only affected by the profit deduction or each closed position.')
avPricePlot              = input.bool (false, group = "Take Profit Settings", title='Plot Average Price (FIFO)')
// Original Take Profit Limit
tpLimit                  = strategy.position_avg_price + (strategy.position_avg_price / 100 * ProfitTarget_Percent_All) 


// Create variables to calculate the Take Profit Limit Progresssion
var endVal   = 0.0   
var startVal = 0.0

// The value at the the start of the loop is the value of the end of the previous loop
startVal := endVal 

// Set variable to the original Take Profit Limit when the first position opens.
if strategy.position_size > 0 and strategy.position_size[1] ==0
    endVal := tpLimit  

// Everytime a specific position opens, the difference of the previous (original) Take Profit price and the current (original) Take Profit price will be deducted from the Progressive Take Profit Limit
// This feature can be toggled on and off in the settings panel. By default it is toggled on.
entryAmount = 0.0
for i = 1 to strategy.opentrades
    entryAmount := i
    if entryOn  and strategy.position_size > 0 and strategy.opentrades[1] == (entryAmount) and strategy.opentrades == (entryAmount + 1)
        endVal := startVal - (tpLimit[1] - tpLimit)

// Everytime a specific position closes, the amount of profit from that specific position will be deducted from the Progressive Take Profit Limit.
exitAmount = 0.0
for id = 1 to strategy.opentrades
    exitAmount := id
    if strategy.opentrades[1] ==(exitAmount + 1) and strategy.opentrades == (exitAmount)
        endVal := startVal - (TakeProfitProgression / 100 * strategy.opentrades.entry_price (id - 1) / 100 * ProfitTarget_Percent )

// The Final Take Profit Price
tpn = (strategy.position_avg_price + (strategy.position_avg_price / 100 * ProfitTarget_Percent_All))  - (strategy.position_avg_price + (strategy.position_avg_price / 100 * ProfitTarget_Percent_All) - endVal)
plot  (strategy.position_size > 0 ? tpn : na, title = "Take Profit Limit", color=color.new(color.red, 0), style = plot.style_linebr, linewidth = 1) 

// Plot position average price as reference
plot  (avPricePlot ? strategy.position_avg_price : na, title= "Average price", color = color.new(color.white, 0), style = plot.style_linebr, linewidth = 1) 


// When to trigger the Take Profit per position or the Progressive Take Profit
tpl1 = close < tpn ? eps1 + close * (ProfitTarget_Percent / 100) : tpn
tpl2 = close < tpn ? eps2 + close * (ProfitTarget_Percent / 100) : tpn
tpl3 = close < tpn ? eps3 + close * (ProfitTarget_Percent / 100) : tpn
tpl4 = close < tpn ? eps4 + close * (ProfitTarget_Percent / 100) : tpn
tpl5 = close < tpn ? eps5 + close * (ProfitTarget_Percent / 100) : tpn
tpl6 = close < tpn ? eps6 + close * (ProfitTarget_Percent / 100) : tpn
tpl7 = close < tpn ? eps7 + close * (ProfitTarget_Percent / 100) : tpn
tpl8 = close < tpn ? eps8 + close * (ProfitTarget_Percent / 100) : tpn


// Submit Entry Orders
if co and strategy.opentrades == 0
    eps1 := long1
    eps2 := long2
    eps3 := long3
    eps4 := long4
    eps5 := long5
    eps6 := long6
    eps7 := long7
    eps8 := long8

    strategy.entry('Long1', strategy.long, q)

if strategy.opentrades == 1
    strategy.entry('Long2', strategy.long, q, limit=eps2)

if strategy.opentrades == 2
    strategy.entry('Long3', strategy.long, q, limit=eps3)

if strategy.opentrades == 3
    strategy.entry('Long4', strategy.long, q, limit=eps4)

if strategy.opentrades == 4
    strategy.entry('Long5', strategy.long, q, limit=eps5)

if strategy.opentrades == 5
    strategy.entry('Long6', strategy.long, q, limit=eps6)

if strategy.opentrades == 6
    strategy.entry('Long7', strategy.long, q, limit=eps7)

if strategy.opentrades == 7
    strategy.entry('Long8', strategy.long, q, limit=eps8)


// Submit Exit orders
if strategy.position_size > 0
    strategy.exit(id='Exit 1', from_entry='Long1', limit=tpl1)
    strategy.exit(id='Exit 2', from_entry='Long2', limit=tpl2)
    strategy.exit(id='Exit 3', from_entry='Long3', limit=tpl3)
    strategy.exit(id='Exit 4', from_entry='Long4', limit=tpl4)
    strategy.exit(id='Exit 5', from_entry='Long5', limit=tpl5)
    strategy.exit(id='Exit 6', from_entry='Long6', limit=tpl6)
    strategy.exit(id='Exit 7', from_entry='Long7', limit=tpl7)
    strategy.exit(id='Exit 8', from_entry='Long8', limit=tpl8)


// Make sure that all open limit orders are canceled after exiting all the positions 
longClose = strategy.position_size[1] > 0 and strategy.position_size == 0 ? 1 : 0
if longClose
    strategy.cancel_all()