Strategi Penjejakan Cahaya Bulan Berganda Segi Tiga

Gambaran keseluruhan
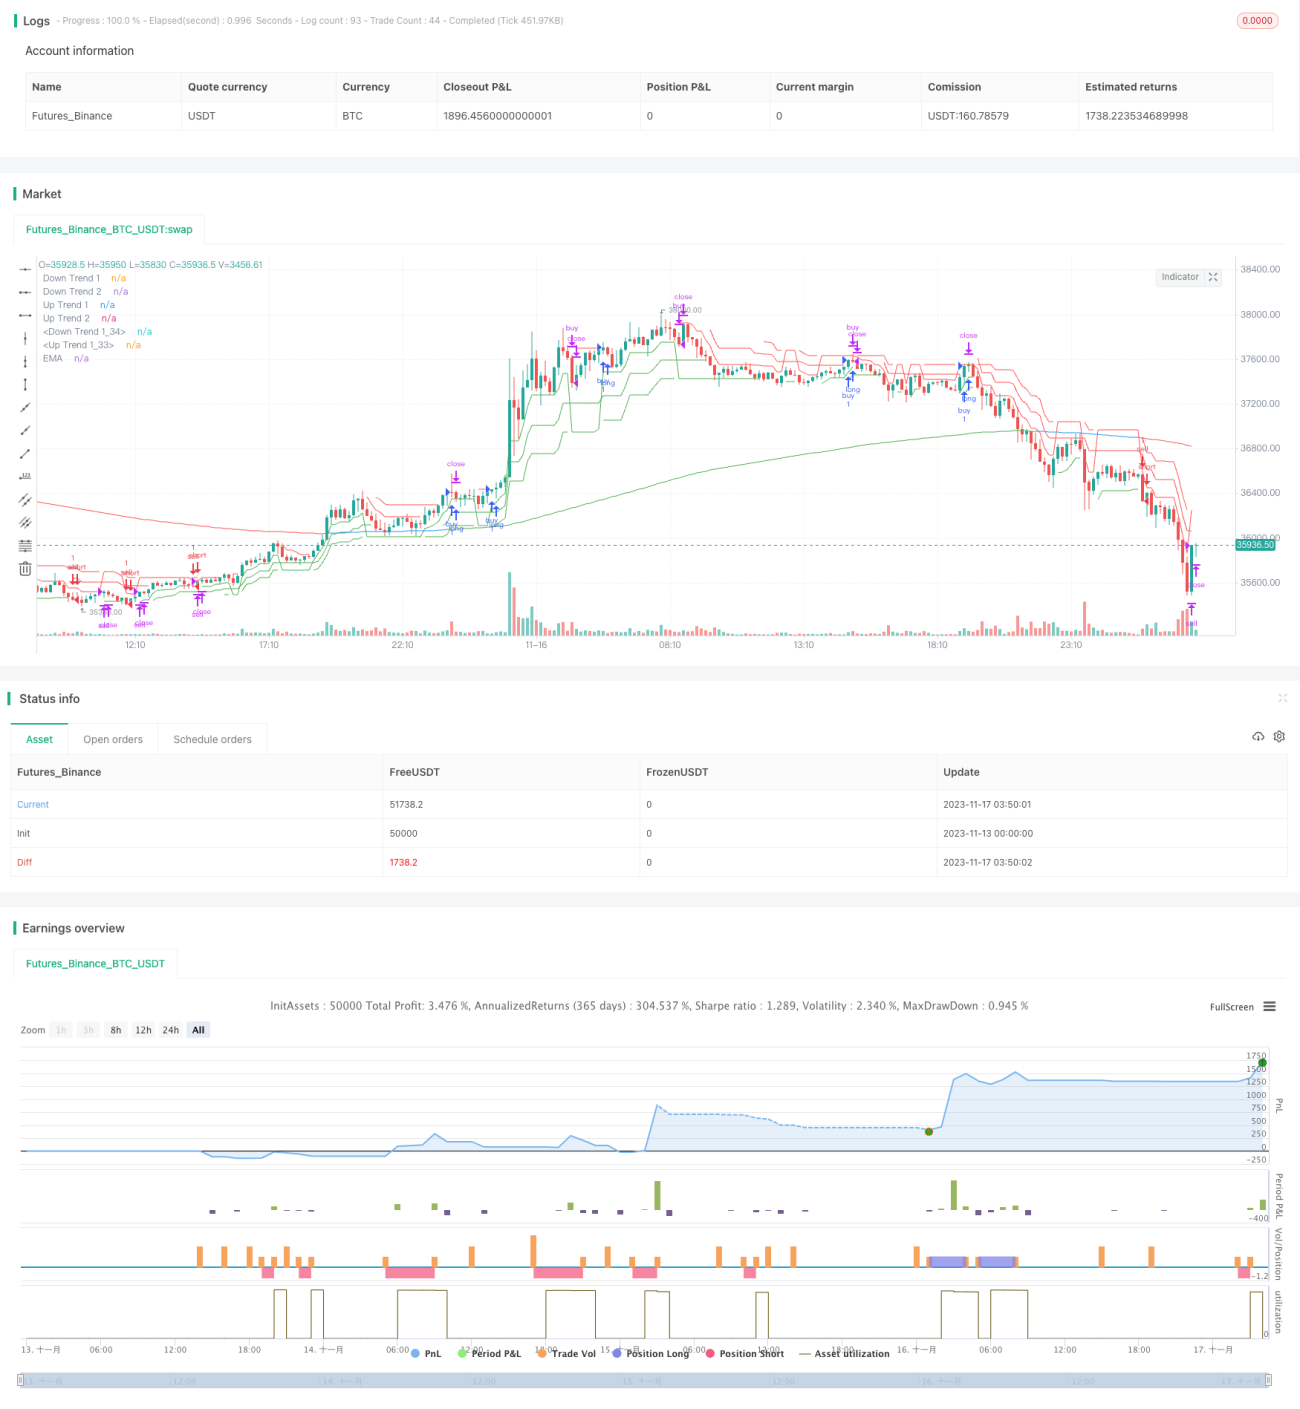
Strategi ini mewujudkan operasi penembusan yang bernasib baik dengan membina saluran dua segi tiga, digabungkan dengan petunjuk trend super untuk menentukan arah penembusan harga. Strategi ini digabungkan dengan EMA untuk menentukan trend keseluruhan pasaran, dan mengelakkan perdagangan yang tidak berkesan dalam keadaan gegaran.
Prinsip Strategi
-
Membina petanda trend super dengan tiga parameter yang berbeza untuk menentukan arah trend harga dalam jangka pendek, sederhana dan jangka panjang.
-
Menentukan sama ada harga telah menembusi saluran naik atau turun, sebagai isyarat ListEntry dan Exit, melalui saluran dua segi tiga.
-
Gabungan 233 kitaran EMA menilai arah trend keseluruhan, harga perlu melakukan lebih banyak untuk menembusi saluran naik di pasaran EMA berbilang, dan kosong untuk menembusi saluran turun di pasaran kosong.
-
Untuk menentukan tanda berhenti dan hentikan dengan menggabungkan tiga indikator super trend. Apabila dua atau lebih indikator berubah warna, hentikan atau hentikan.
Kelebihan Strategik
-
Saluran dua segitiga digabungkan dengan penilaian kitaran masa yang berlainan untuk menangkap penembusan trend secara tepat.
-
Syarat penyaringan pelbagai peringkat dapat mengelakkan transaksi yang tidak sah dan meningkatkan peluang kemenangan.
-
Tracking Stop Loss Dinamika, mengurangkan risiko penarikan balik.
-
Tetapan parameter yang mudah dan mudah difahami.
Risiko dan pengoptimuman strategi
-
Dalam pasaran goyah kitaran besar, mungkin terdapat keadaan yang sering membuka kedudukan dan kemudian dihentikan. Parameter kitaran ATR boleh disesuaikan dengan sewajarnya untuk mengurangkan frekuensi pembukaan kedudukan.
-
Tempoh EMA yang terlalu pendek tidak dapat menentukan trend keseluruhan, dan terlalu lama tidak dapat dikesan. Ujian disyorkan untuk menentukan parameter EMA yang optimum.
-
Tahap Stop Loss tidak dapat mengikuti pergerakan pergerakan pasaran secara dinamik dan memerlukan intervensi manusia. Pada masa akan datang, anda boleh mempertimbangkan untuk menyesuaikan jarak Stop Loss secara dinamik dengan ATR.
ringkaskan
Strategi penembusan dua segitiga Moonlight Tracker dengan menggabungkan indikator trend super dengan saluran dua segitiga, dapat menangkap penembusan yang kuat dengan tepat. Pada masa yang sama, mekanisme penapisan bertingkat dapat menapis isyarat yang tidak berkesan, dengan kemenangan yang lebih tinggi. Tetapan parameter yang mudah juga memudahkan penggunaannya.
- 1