Strategi pelarian kejutan aliran super rangka masa merentas
Gambaran keseluruhan
Strategi ini menggabungkan indikator supertrend dengan indikator Brin Belt dalam pelbagai bingkai masa, mengenal pasti arah trend dan titik rintangan sokongan utama, membuat Entries ketika terjatuh, dan berdasarkan kedudukan keluar silang. Strategi ini terutama digunakan untuk jenis masa depan komoditi yang berfluktuasi tinggi, seperti emas, perak, minyak mentah, dan lain-lain.
Prinsip Strategi
Fungsi Super Trend Multi-Frames Custom yang ditulis berdasarkan Pine Scriptpine_supertrend(), menggabungkan trend super dengan kitaran yang berbeza (contohnya 1 minit dan 5 minit) untuk menentukan arah trend kitaran besar.
Pada masa yang sama, kiraan Bolling band ke bawah, untuk membuat keputusan mengenai terobosan saluran. Apabila harga menembusi Bolling band ke atas, dianggap sebagai terobosan di bawah; apabila harga jatuh ke bawah Bolling band ke bawah, dianggap sebagai terobosan turun.
Isyarat strategik:
Isyarat berbilang arah: harga penutupan > Brin berlari ke arah yang betul dan harga penutupan > Indeks Super Trend Multi-Frames Isyarat kosong: harga penutupan < Brin turun ke bawah dan harga penutupan < Indeks tren super jangka masa
Hentikan Kerosakan:
Hentian pelbagai kepala: harga penutupan < 5 minit Hentian kosong: harga penutupan > 5 minit petanda trend super
Oleh itu, strategi untuk menangkap resonansi terobosan antara penunjuk supertrend dan penunjuk Brin, untuk memproses transaksi dalam keadaan yang bergelombang tinggi.
Analisis kelebihan
- Menggunakan indikator trend super pelbagai bingkai masa untuk menentukan arah trend kitaran besar, meningkatkan kualiti isyarat
- Brin berbaris ke bawah sebagai titik rintangan sokongan utama, yang dapat mengurangkan penembusan palsu
- Indikator Super Trend sebagai Stop Loss, mengurangkan kerugian, mengawal risiko
Analisis risiko
- Indikator Supertrend berlainan arah, mungkin terlepas titik perubahan trend
- Setup parameter Brinband yang tidak betul boleh menyebabkan terlalu kerap atau terlalu banyak kehilangan perdagangan
- Harga berfluktuasi dengan ketara dan mudah terjejas apabila berlakunya pasaran malam atau peristiwa besar
Penyelesaian risiko:
- Digabungkan dengan pelbagai penunjuk tambahan untuk mengesahkan isyarat dan mengelakkan penembusan palsu
- Optimumkan parameter Brin untuk mencari titik keseimbangan yang optimum
- Sesuaikan kedudukan hentian untuk meluaskan jarak hentian
Arah pengoptimuman
- Mencuba penunjuk trend lain seperti KDJ, MACD dan lain-lain sebagai penilaian tambahan
- Meningkatkan kebarangkalian penilaian model pembelajaran mesin sebagai bantuan
- Mengoptimumkan parameter untuk mencari kombinasi parameter super optimum
ringkaskan
Strategi ini mengintegrasikan supertrend dengan dua indikator yang sangat cekap di Brin Belt, untuk mencapai peluang yang tinggi melalui analisis jangka masa dan penilaian terobosan saluran. Strategi ini mengawal risiko dana dengan berkesan dan membuktikan bahawa keuntungan yang lebih baik dapat diperoleh dalam varieti yang bergelombang tinggi.
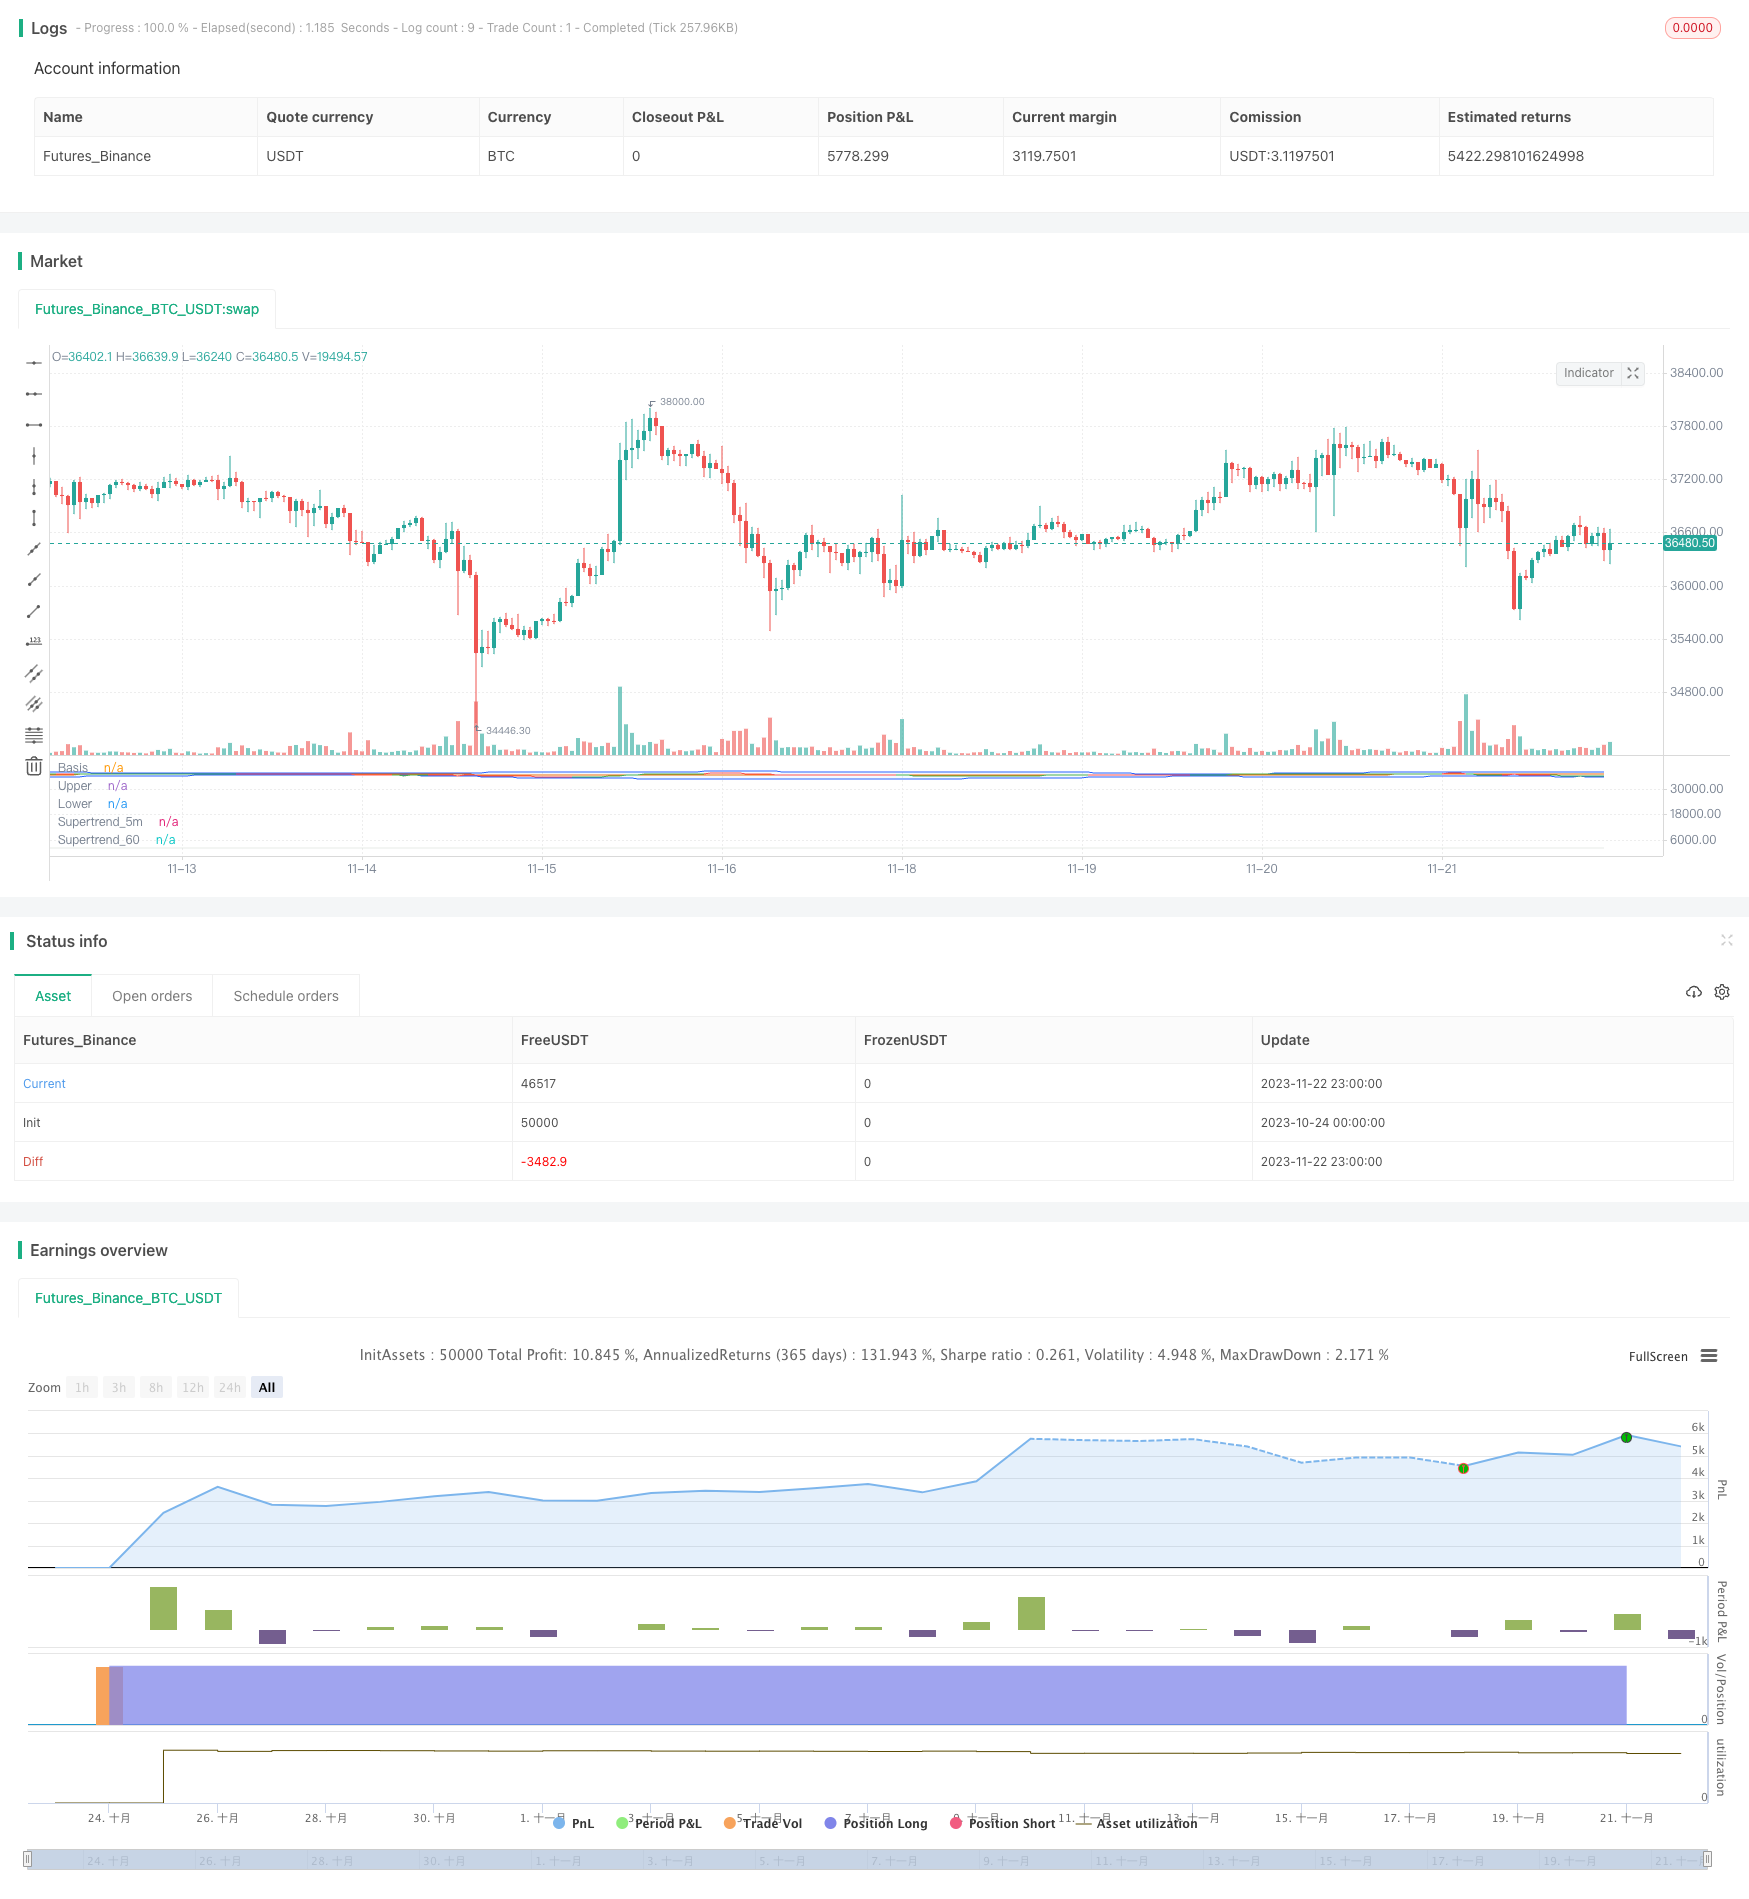
/*backtest
start: 2023-10-24 00:00:00
end: 2023-11-23 00:00:00
period: 1h
basePeriod: 15m
exchanges: [{"eid":"Futures_Binance","currency":"BTC_USDT"}]
*/

// This source code is subject to the terms of the Mozilla Public License 2.0 at https://mozilla.org/MPL/2.0/
// © ambreshc95

//@version=5
strategy("Comodity_SPL_Strategy_01", overlay=false)

// function of st
// [supertrend, direction] = ta.supertrend(3, 10)
// plot(direction < 0 ? supertrend : na, "Up direction", color = color.green, style=plot.style_linebr)
// plot(direction > 0 ? supertrend : na, "Down direction", color = color.red, style=plot.style_linebr)

// VWAP
// src_vwap = input(title = "Source", defval = hlc3, group="VWAP Settings")
// [_Vwap,stdv,_] = ta.vwap(src_vwap,false,1)
// plot(_Vwap, title="VWAP", color = color.rgb(0, 0, 0))


// The same on Pine Script®
pine_supertrend(factor, atrPeriod,len_ma) =>

    h= ta.sma(high,len_ma)
    l= ta.sma(low,len_ma)
    hlc_3 = (h+l)/2
    src = hlc_3
    atr = ta.atr(atrPeriod)
    upperBand = src + factor * atr
    lowerBand = src - factor * atr
    prevLowerBand = nz(lowerBand[1])
    prevUpperBand = nz(upperBand[1])

    lowerBand := lowerBand > prevLowerBand or close[1] < prevLowerBand ? lowerBand : prevLowerBand
    upperBand := upperBand < prevUpperBand or close[1] > prevUpperBand ? upperBand : prevUpperBand
    int direction = na
    float superTrend = na
    prevSuperTrend = superTrend[1]
    if na(atr[1])
        direction := 1
    else if prevSuperTrend == prevUpperBand
        direction := close > upperBand ? -1 : 1
    else
        direction := close < lowerBand ? 1 : -1
    superTrend := direction == -1 ? lowerBand : upperBand
    [superTrend, direction]
len_ma_given = input(75, title="MA_SMA_ST")
[Pine_Supertrend, pineDirection] = pine_supertrend(3, 10,len_ma_given)
// plot(pineDirection < 0 ? Pine_Supertrend : na, "Up direction", color = color.green, style=plot.style_linebr)
// plot(pineDirection > 0 ? Pine_Supertrend : na, "Down direction", color = color.red, style=plot.style_linebr)
//
// Define Supertrend parameters
atrLength = input(10, title="ATR Length")
factor = input(3.0, title="Factor")

// // Calculate Supertrend
[supertrend, direction] = ta.supertrend(factor, atrLength)

st_color = supertrend > close ? color.red : color.green
// // Plot Supertrend
// plot(supertrend, "Supertrend", st_color)
//

// BB Ploting
length = input.int(75, minval=1)
maType = input.string("SMA", "Basis MA Type", options = ["SMA", "EMA", "SMMA (RMA)", "WMA", "VWMA"])
src = input(close, title="Source")
mult = input.float(2.5, minval=0.001, maxval=50, title="StdDev")

ma(source, length, _type) =>
    switch _type
        "SMA" => ta.sma(source, length)
        "EMA" => ta.ema(source, length)
        "SMMA (RMA)" => ta.rma(source, length)
        "WMA" => ta.wma(source, length)
        "VWMA" => ta.vwma(source, length)

basis = ma(src, length, maType)
dev = mult * ta.stdev(src, length)
upper = basis + dev
lower = basis - dev
offset = input.int(0, "Offset", minval = -500, maxval = 500)
plot(basis, "Basis", color=#FF6D00, offset = offset)
p1 = plot(upper, "Upper", color=#2962FF, offset = offset)
p2 = plot(lower, "Lower", color=#2962FF, offset = offset)
fill(p1, p2, title = "Background", color=color.rgb(33, 150, 243, 95))


// h= ta.sma(high,60)
// l= ta.sma(low,60)
// c= sma(close,60)
// hlc_3 = (h+l)/2
// supertrend60 = request.security(syminfo.tickerid,  supertrend)

// // Define timeframes for signals
tf1 = input(title="Timeframe 1", defval="1")
tf2 = input(title="Timeframe 2",defval="5")
// tf3 = input(title="Timeframe 3",defval="30")


// // // Calculate Supertrend on multiple timeframes
supertrend_60 = request.security(syminfo.tickerid, tf1, Pine_Supertrend)
supertrend_5m = request.security(syminfo.tickerid, tf2, supertrend)
// supertrend3 = request.security(syminfo.tickerid, tf3, supertrend)

// // Plot Supertrend_60
st_color_60 = supertrend_60 > close ? color.rgb(210, 202, 202, 69) : color.rgb(203, 211, 203, 52)
plot(supertrend_60, "Supertrend_60", st_color_60)

// // Plot Supertrend_5m
st_color_5m = supertrend_5m > close ? color.red : color.green
plot(supertrend_5m, "Supertrend_5m", st_color_5m)


ma21 = ta.sma(close,21)
// rsi = ta.rsi(close,14)
// rsima = ta.sma(rsi,14)

// Define the Indian Standard Time (IST) offset from GMT
ist_offset = 5.5 // IST is GMT+5:30

// Define the start and end times of the trading session in IST
// start_time = timestamp("GMT", year, month, dayofmonth, 10, 0) + ist_offset * 60 * 60
// end_time = timestamp("GMT", year, month, dayofmonth, 14, 0) + ist_offset * 60 * 60
// Check if the current time is within the trading session
// in_trading_session = timenow >= start_time and timenow <= end_time

in_trading_session = not na(time(timeframe.period, "0945-1430"))
// bgcolor(inSession ? color.silver : na)
out_trading_session = not na(time(timeframe.period, "1515-1530"))
// // // Define buy and sell signals
buySignal = close>upper and close > supertrend_5m and close > supertrend_60 and close > ma21  and in_trading_session //close > supertrend and
sellSignal = close<lower and close < supertrend_5m and close < supertrend_60 and close < ma21  and in_trading_session //close < supertrend and

var bool long_position = false
var bool long_exit = false
var float long_entry_price = 0
var float short_entry_price = 0

if buySignal and not long_position
    // label.new(bar_index, na, yloc = yloc.belowbar, style = label.style_label_up, color = color.green, size = size.small)
    long_position := true
    strategy.entry("Buy",strategy.long)

long_exit := (close < supertrend_5m)
if long_position and long_exit
    // label.new(bar_index, na, yloc = yloc.belowbar, style = label.style_xcross, color = color.green, size = size.tiny)
    long_position := false
    strategy.exit("Exit","Buy",stop = close)

var bool short_position = false
var bool short_exit = false
if sellSignal and not short_position
    // label.new(bar_index, na, yloc = yloc.abovebar, style = label.style_label_down, color = color.red, size = size.small)
    short_position := true
    strategy.entry("Sell",strategy.short)

short_exit := (close > supertrend_5m)
if short_position and short_exit
    // label.new(bar_index, na, yloc = yloc.belowbar, style = label.style_xcross, color = color.red, size = size.tiny)
    short_position := false
    strategy.exit("Exit","Sell", stop = close)

if out_trading_session
    long_position := false
    strategy.exit("Exit","Buy",stop = close)
    short_position := false
    strategy.exit("Exit","Sell", stop = close)

// if long_position
//     long_entry_price := close[1] + 50//bar_index

// if short_position
//     short_entry_price := close[1] - 50//bar_index

// if (long_position and high[1] > long_entry_price)
//     label.new(bar_index, na, yloc = yloc.abovebar, style = label.style_triangledown, color = color.yellow, size = size.tiny)

// if (short_position and low[1] < short_entry_price)
//     label.new(bar_index, na, yloc = yloc.belowbar, style = label.style_triangleup, color = color.yellow, size = size.tiny)