Strategi menaik dan menurun berdasarkan saluran turun naik harga dalaman

Gambaran keseluruhan
Strategi ini menggunakan saluran dalaman harga untuk menentukan pergerakan harga masa depan, termasuk dalam strategi mengikuti trend. Apabila harga membentuk sebilangan saluran dalaman harga yang bergelombang, menilai sebagai isyarat perubahan trend, melakukan pembelian atau penjualan. Bersama-sama dengan penapis purata bergerak dan tetapan stop loss untuk mengunci keuntungan, termasuk dalam strategi perdagangan kuantitatif yang lebih biasa.
Prinsip Strategi
Strategi ini menilai pembentukan saluran dalaman berdasarkan hubungan besar antara harga tertinggi dan harga terendah pada dua baris K di hadapan dan di belakang. Apabila sejumlah baris K memenuhi syarat harga tertinggi lebih rendah daripada harga tertinggi baris K sebelumnya, dan harga terendah lebih tinggi daripada harga terendah baris K sebelumnya, maka ia dinilai sebagai saluran dalaman harga.
Strategi ini juga menilai arah saluran dalaman semasa menilai pembentukan saluran dalaman harga. Jika saluran dalaman mendaki, ia menghasilkan isyarat beli; jika saluran dalaman turun, ia menghasilkan isyarat jual. Oleh itu, strategi ini adalah strategi perdagangan dua hala.
Untuk menapis isyarat palsu, strategi ini juga memperkenalkan penunjuk purata bergerak. Isyarat perdagangan sebenar hanya dihasilkan apabila harga berada di atas atau di bawah purata bergerak. Ini dapat mengelakkan perdagangan yang salah dalam menyusun pasaran.
Selepas masuk, strategi juga akan mengikut pilihan pengguna, menetapkan titik berhenti kerugian. Terdapat tiga jenis penutupan yang boleh dipilih: titik berhenti tetap, penutupan ATR, penutupan titik tertinggi dan terendah sebelum ini. Tetapan berhenti adalah penutupan nisbah pulangan risiko. Ini dapat mengunci keuntungan dan mengawal risiko hingga tahap tertentu.
Analisis kelebihan
Kelebihan utama strategi ini adalah keupayaan yang kuat untuk mengenal pasti titik-titik perubahan trend. Apabila harga membentuk sebilangan saluran dalaman, ia sering menandakan penurunan yang lebih besar. Keputusan ini sangat sesuai dengan teori analisis teknikal tradisional.
Selain itu, strategi itu sendiri sangat mudah dikonfigurasi. Pengguna boleh bebas memilih bilangan saluran dalaman, kitaran purata bergerak, dan parameter seperti cara menghentikan kerugian. Ini memberikan fleksibiliti yang sangat besar untuk pelbagai jenis dan gaya perdagangan yang berbeza.
Akhirnya, penapis purata bergerak dan seting stop loss yang dimasukkan ke dalam strategi juga mengurangkan risiko perdagangan. Strategi ini boleh digunakan untuk berdagang dalam pelbagai keadaan pasaran.
Analisis risiko
Risiko terbesar dalam strategi ini adalah bahawa terdapat kemungkinan besar kesalahan dalam penilaian trend. Saluran dalaman tidak dapat menentukan sepenuhnya pembalikan harga, terdapat kemungkinan kesalahan tertentu. Jika jumlah yang ditentukan tidak mencukupi, kemungkinan terdapat isyarat palsu.
Di samping itu, dalam pasaran yang bertolak ansur atau bergolak, strategi ini tidak berlaku sama sekali. Apabila harga turun naik tetapi tidak menubuhkan trend, strategi ini akan menghasilkan isyarat yang salah secara berturut-turut. Ini adalah kerana mekanisme strategi yang ditentukan.
Akhirnya, penyetempatan stop loss yang terlalu konservatif juga boleh menyebabkan strategi tidak dapat bertahan cukup lama dan tidak dapat menangkap keuntungan dalam trend besar.
Arah pengoptimuman
Strategi ini mempunyai ruang untuk pengoptimuman yang lebih luas. Beberapa arah pengoptimuman yang mungkin termasuk:
-
Mengoptimumkan jumlah dan bentuk saluran dalaman. Anda boleh menguji keberkesanan urus niaga dalam jumlah yang berbeza atau kombinasi susunan yang berbeza.
-
Mengoptimumkan parameter kitaran purata bergerak untuk menilai arah trend dengan lebih baik. Kitaran lalai semasa mungkin tidak sesuai untuk semua jenis.
-
Menambah penapis petunjuk lain. Sebagai contoh, pengenalan Bollinger Bands, yang menghasilkan isyarat perdagangan hanya apabila harga menembusi Bollinger Bands ke atas atau ke bawah.
-
Mengoptimumkan parameter stop loss yang membolehkan strategi memegang kedudukan untuk jangka masa yang lebih lama. Dengan itu, ia dapat menangkap keuntungan dalam super trend.
Secara keseluruhannya, strategi ini wujud dengan ketepatan penghakiman trendnya. Perdagangan algoritma yang lebih berkesan boleh dilakukan dengan memastikan ketepatan penghakiman, ditambah dengan tetapan pengurusan risiko yang sesuai.
ringkaskan
Strategi ini secara keseluruhan adalah strategi perdagangan kuantitatif yang menilai trend harga masa depan berdasarkan saluran dalaman harga. Ia menggabungkan dua kaedah penilaian, trend tracking dan trend reversal, dengan kelebihan tertentu. Tetapi ada ruang untuk pengoptimuman, dan pelabur dapat menyesuaikan dengan keperluan mereka sendiri, sesuai dengan varieti dan persekitaran perdagangan tertentu.
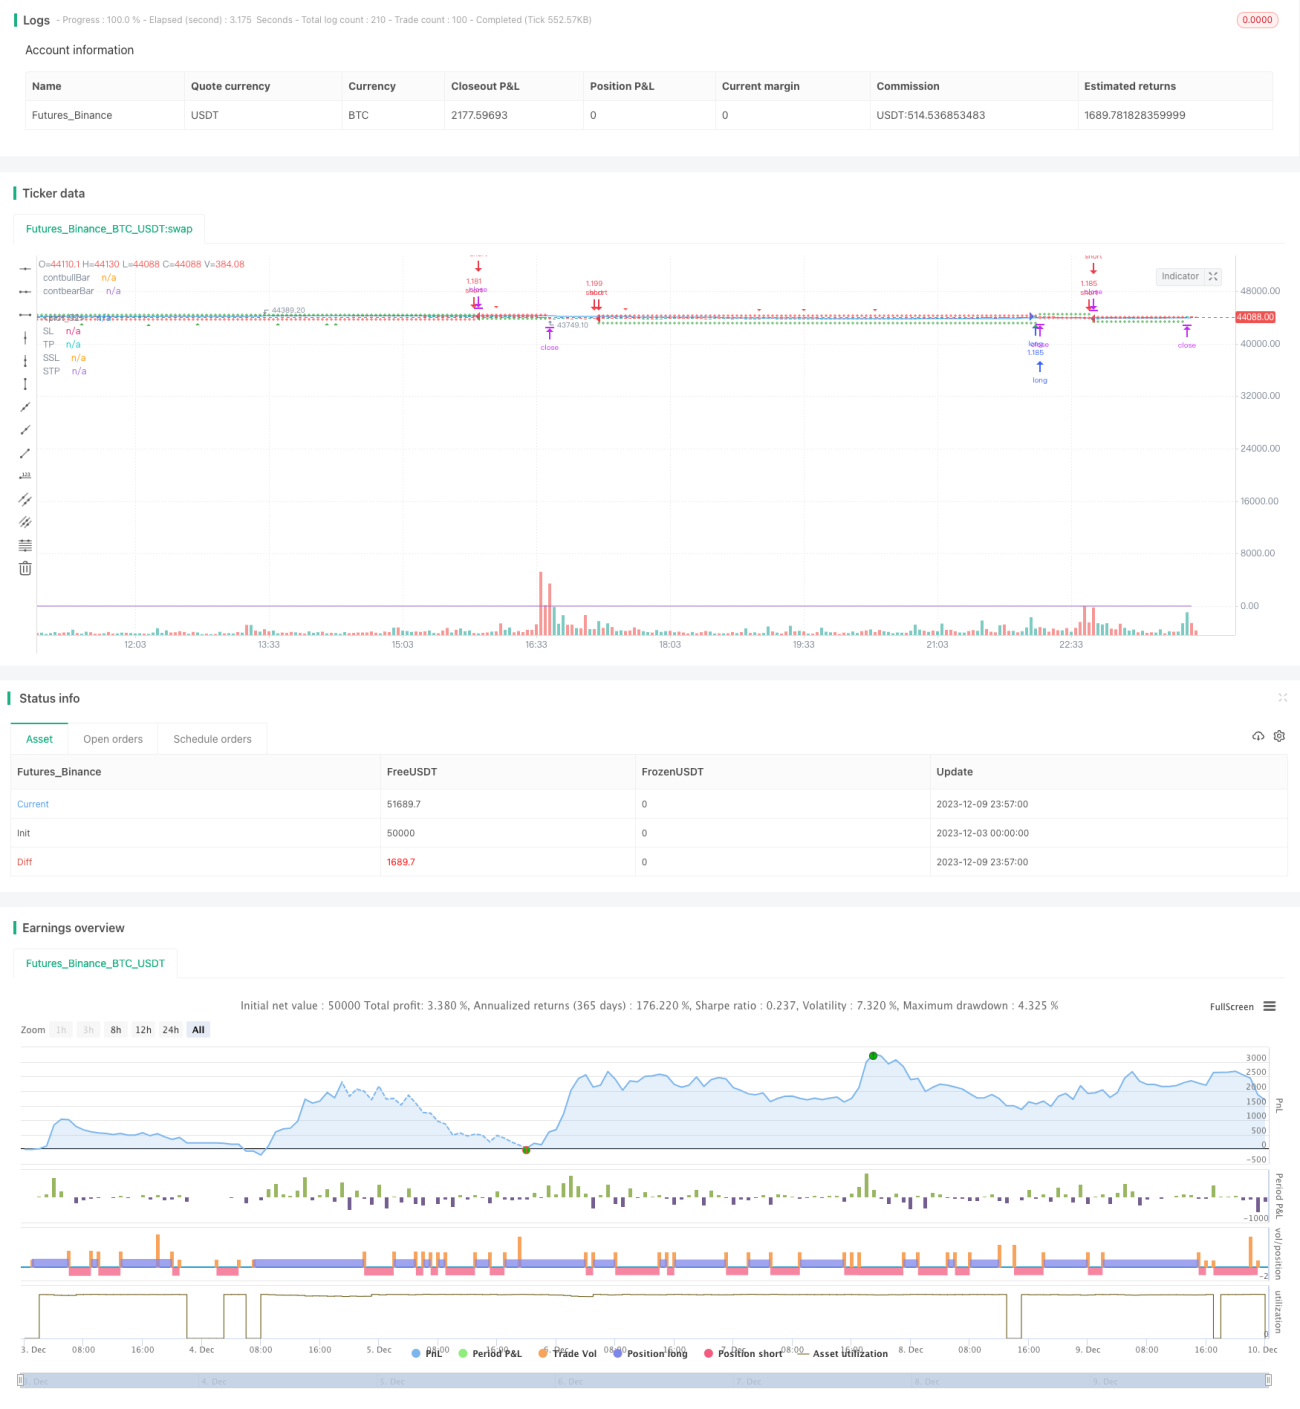
/*backtest
start: 2023-12-03 00:00:00
end: 2023-12-10 00:00:00
period: 3m
basePeriod: 1m
exchanges: [{"eid":"Futures_Binance","currency":"BTC_USDT"}]
*/

// This source code is subject to the terms of the Mozilla Public License 2.0 at https://mozilla.org/MPL/2.0/

// From "Day Trading Cryptocurrency
// Strategies, Tactics, Mindset, and Tools Required To Build Your - 1