Strategi Penjejakan Momentum Suai Berbilang Faktor


Tarikh penciptaan: 2023-12-12 12:02:13 Akhirnya diubah suai: 2023-12-12 12:02:13
Salin: 0 Bilangan klik: 648
1
fokus pada
1621
Pengikut

Strategi Penjejakan Momentum Suai Berbilang Faktor

Gambaran keseluruhan

Strategi penjejakan momentum beradaptasi berbilang faktor mengiktiraf trend pasaran dan tahap rintangan sokongan utama dengan mengintegrasikan pelbagai petunjuk teknikal untuk membolehkan perdagangan automatik terhadap aset yang berfluktuasi tinggi seperti mata wang kripto. Strategi ini menggunakan indikator seperti RSI, MACD, dan Stochastic untuk menentukan masa membeli dan menjual, sambil menggabungkan peratusan perubahan harga untuk mengenal pasti bentuk yang lebih tepat.

Prinsip Strategi

Pusat strategi pengesanan dinamik beradaptasi pelbagai faktor adalah penggunaan bersepadu pelbagai petunjuk teknikal. Strategi ini digunakan terutamanya untuk beberapa komponen berikut:

  1. Indeks RSI menilai overbought dan oversold. Dengan menggunakan parameter yang berbeza, ia dapat mengenal pasti isyarat RSI biasa atau isyarat RSI Corner yang lebih baik untuk menentukan apakah ada peluang untuk berbalik.

  2. Penunjuk MACD membantu menentukan arah trend. Apabila MACD melintasi atau melintasi garis isyarat, ia menghasilkan isyarat beli dan jual.

  3. Indikator Stochastic mengenal pasti kawasan overbought dan oversold.

  4. Peratusan perubahan harga memeriksa sama ada penembusan sebenar. Mengira peratusan perubahan harga tertinggi, harga terendah, dan harga penutupan dalam tempoh tertentu untuk menentukan sama ada ia merupakan penembusan sebenar.

  5. Indeks EMA menilai ketidaksuburan di peringkat besar. Di atas garis cepat, garis perlahan adalah isyarat bullish, di bawah adalah isyarat bearish.

Strategi ini memilih untuk melakukan lebih banyak shorting mengikut keadaan pasaran yang kosong, dan menetapkan stop loss stop setelah memasuki kedudukan, untuk mengawal risiko dengan berkesan. Apabila isyarat pembalikan muncul, pilih keluar dari kedudukan kosong. Seluruh proses keputusan menggabungkan banyak faktor penilaian, sehingga dapat membuat keputusan yang lebih tepat.

Analisis kelebihan

Strategi ini mempunyai beberapa kelebihan:

  1. Pemanduan pelbagai faktor mempunyai kelebihan penilaian. Berbanding dengan satu petunjuk, kombinasi pelbagai petunjuk dapat diverifikasi antara satu sama lain, menjadikan hasilnya lebih tepat dan boleh dipercayai, dan dengan itu menjimatkan kos transaksi yang tidak perlu.

  2. Syarat ketat untuk mengelakkan perdagangan yang salah. Strategi menetapkan syarat ketat untuk pembelian dan penjualan, memerlukan beberapa indikator untuk melepaskan isyarat pada masa yang sama, sehingga dapat menyaring banyak bunyi bising dan mengelakkan perdagangan yang salah.

  3. Keupayaan strategi untuk secara dinamik mengira parameter penunjuk, mengelakkan subjektiviti pilihan super, dan menjadikan parameter strategi lebih objektif secara saintifik.

  4. Mekanisme Hentikan Kerosakan Mengendalikan Risiko. Strategi akan mengira dan memetakan kedudukan Hentikan Kerosakan dalam masa nyata selepas membuka kedudukan, yang dapat mengawal kerugian tunggal dengan berkesan, untuk mengelakkan kemunculan kedudukan pecah.

Analisis risiko

Strategi ini juga mempunyai beberapa risiko yang perlu dielakkan:

  1. Kebarangkalian penunjuk salah melepaskan isyarat. Walaupun pengesahan pelbagai penunjuk dapat mengurangkan kadar isyarat yang salah, kemungkinan masih berlaku. Ini mungkin menyebabkan kerugian yang tidak perlu.

  2. Risiko penutupan yang terganggu. Dalam keadaan yang melampau, harga mungkin jatuh secara mendadak, menyebabkan penutupan yang asal mudah terganggu, menyebabkan kerugian yang lebih besar.

  3. Kelebihan pengoptimuman yang disebabkan oleh pengoptimuman parameter. Walaupun parameter dinamik mengelakkan subjektiviti yang disebabkan oleh pemilihan buatan, ia juga boleh menyebabkan pengoptimuman parameter yang berlebihan dan kehilangan keupayaan generalisasi.

Penyelesaian:

  1. Peningkatan tahap kekukuhan syarat penapisan isyarat, mengurangkan kadar isyarat salah.
  2. Menggunakan kaedah pembinaan dalam kumpulan untuk mengelakkan kerugian yang berlebihan.
  3. Meningkatkan jumlah sampel ujian, menilai kestabilan parameter secara ketat.

Arah pengoptimuman strategi

Terdapat beberapa dimensi yang boleh dioptimumkan untuk strategi pengesanan dinamik beradaptasi pelbagai faktor:

  1. Peningkatan jumlah faktor penghakiman. Penghakiman tambahan dengan lebih banyak jenis isyarat penunjuk, seperti kadar turun naik, jumlah dagangan.

  2. Algoritma mekanisme hentian yang dioptimumkan. Algoritma hentian yang lebih maju seperti hentian pengesanan, hentian guncangan dan lain-lain boleh diperkenalkan untuk mengurangkan lagi kebarangkalian hentian yang ditembusi.

  3. Memperkenalkan model pembelajaran mesin. Menggunakan model seperti RNN, LSTM untuk memodelkan data sejarah untuk membantu membuat keputusan pembelian dan penjualan.

  4. Strategi integrasi. Mengambil lebih banyak sub-strategi, dan menggunakan kaedah pembelajaran bersepadu untuk mengintegrasikan, prestasi komprehensif yang lebih stabil dapat diperoleh.

ringkaskan

Strategi pemantauan momentum beradaptasi pelbagai faktor mengintegrasikan penggunaan pelbagai penunjuk teknikal untuk mengenal pasti masa membeli dan menjual. Penghakiman strategi lebih tepat berbanding dengan penunjuk tunggal, sementara parameter terbina dalam menyesuaikan diri dan mengawal risiko mekanisme hentian. Langkah seterusnya adalah dengan memperkenalkan lebih banyak faktor penilaian tambahan, algoritma hentian canggih, dan pembelajaran mesin.
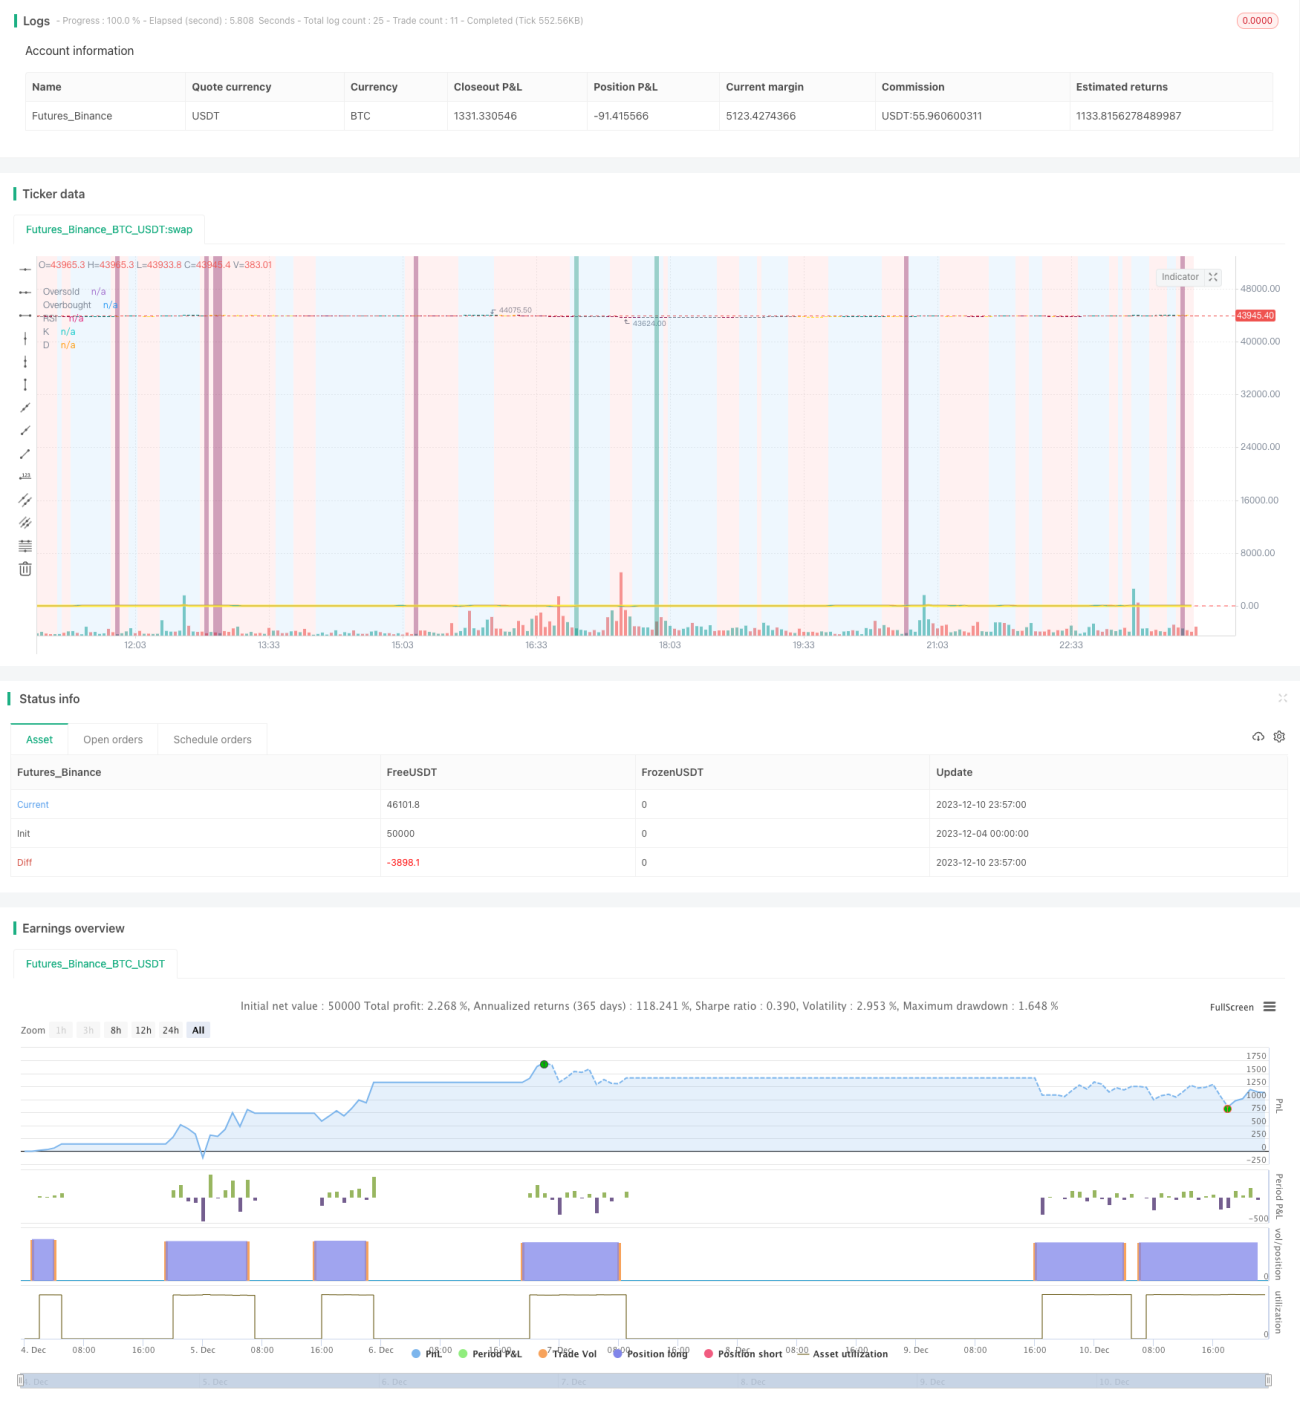
Kod sumber strategi
/*backtest
start: 2023-12-04 00:00:00
end: 2023-12-11 00:00:00
period: 3m
basePeriod: 1m
exchanges: [{"eid":"Futures_Binance","currency":"BTC_USDT"}]
*/

// This source code is subject to the terms of the Mozilla Public License 2.0 at https://mozilla.org/MPL/2.0/
//@version=4

// ██████╗██████╗ ███████╗ █████╗ ████████╗███████╗██████╗     ██████╗ ██╗   ██╗    
//██╔════╝██╔══██╗██╔════╝██╔══██╗╚══██╔══╝██╔════╝██╔══██╗    ██╔══██╗╚██╗ ██╔╝                       
//██║     ██████╔╝█████╗  ███████║   ██║   █████╗  ██║  ██║    ██████╔╝ ╚████╔╝                        
//██║     ██╔══██╗██╔══╝  ██╔══██║   ██║   ██╔══╝  ██║  ██║    ██╔══██╗  ╚██╔╝                         
//╚██████╗██║  ██║███████╗██║  ██║   ██║   ███████╗██████╔╝    ██████╔╝   ██║                          
// ╚═════╝╚═╝  ╚═╝╚══════╝╚═╝  ╚═╝   ╚═╝   ╚══════╝╚═════╝     ╚═════╝    ╚═╝                          
                                                                                                     
//███████╗ ██████╗ ██╗     ██╗   ██╗████████╗██╗ ██████╗ ███╗   ██╗███████╗ ██╗ █████╗ ███████╗ █████╗ 
//██╔════╝██╔═══██╗██║     ██║   ██║╚══██╔══╝██║██╔═══██╗████╗  ██║██╔════╝███║██╔══██╗╚════██║██╔══██╗
//███████╗██║   ██║██║     ██║   ██║   ██║   ██║██║   ██║██╔██╗ ██║███████╗╚██║╚██████║    ██╔╝╚█████╔╝
//╚════██║██║   ██║██║     ██║   ██║   ██║   ██║██║   ██║██║╚██╗██║╚════██║ ██║ ╚═══██║   ██╔╝ ██╔══██╗
//███████║╚██████╔╝███████╗╚██████╔╝   ██║   ██║╚██████╔╝██║ ╚████║███████║ ██║ █████╔╝   ██║  ╚█████╔╝
//╚══════╝ ╚═════╝ ╚══════╝ ╚═════╝    ╚═╝   ╚═╝ ╚═════╝ ╚═╝  ╚═══╝╚══════╝ ╚═╝ ╚════╝    ╚═╝   ╚════╝ 

strategy(shorttitle='Ain1 No Label',title='All in One Strategy no RSI Label', overlay=true, scale=scale.left, initial_capital = 1000, process_orders_on_close=true, default_qty_type = strategy.percent_of_equity, default_qty_value = 100, commission_type=strategy.commission.percent, commission_value=0.18, calc_on_every_tick=true)

kcolor = color.new(#0094FF, 60)
dcolor = color.new(#FF6A00, 60)


// -----------------  Strategy Inputs -------------------------------------------------------------
//Backtest dates with auto finish date of today
start = input(defval = timestamp("01 April 2021 00:00 -0500"), title = "Start Time", type = input.time)
finish = input(defval = timestamp("31 December 2021 00:00 -0600"), title = "End Time", type = input.time)
window()  => true       // create function "within window of time"


// Strategy Selection - Long, Short, or Both
stratinfo = input(true, "Long/Short for Mixed Market, Long for Bull, Short for Bear")
strat = input(title="Trade Types", defval="Long/Short", options=["Long Only", "Long/Short", "Short Only"])
strat_val = strat == "Long Only" ? 1 : strat == "Long/Short" ? 0 : -1

// Risk Management Inputs
sl= input(10.0, "Stop Loss %", minval = 0, maxval = 100, step = 0.01)
stoploss = sl/100
tp = input(20.0, "Target Profit %", minval = 0, maxval = 100, step = 0.01)
TargetProfit = tp/100


useXRSI = input(false, "Use RSI crossing back, select only one strategy")
useCRSI = input(false, "Use Tweaked Connors RSI, select only one")
RSIInfo = input(true, "These are the RSI Strategy Inputs, RSI Length applies to MACD, set OB and OS to 45 for using Stoch and EMA strategies.")
length = input(14, "RSI Length", minval=1)
overbought= input(62, "Overbought")
oversold= input(35, "Oversold")
cl1 = input(3, "Connor's MA Length 1", minval=1, step=1)
cl2 = input(20, "Connor's MA Lenght 2", minval=1, step=1)
cl3 = input(50, "Connor's MA Lenght 3", minval=1, step=1)

// MACD and EMA Inputs
useMACD = input(false, "Use MACD Only, select only one strategy")
useEMA  = input(false, "Use EMA Only, select only one strategy (EMA uses Stochastic inputs too)")
MACDInfo=input(true, "These are the MACD strategy variables")
fastLength = input(5, minval=1, title="EMA Fast Length")
slowLength = input(10, minval=1, title="EMA Slow Length")
ob_min = input(52, "Overbought Lookback Minimum Value", minval=0, maxval=200)
ob_lb = input(25, "Overbought Lookback Bars", minval=0, maxval=100)
os_min = input(50, "Oversold Lookback Minimum Value", minval=0, maxval=200)
os_lb = input(35, "Oversold Lookback Bars", minval=0, maxval=100)
source = input(title="Source", type=input.source, defval=close)
RSI = rsi(source, length)


// Price Movement Inputs
PriceInfo = input(true, "Price Change Percentage Cross Check Inputs for all Strategies, added logic to avoid early sell")
lkbk = input(5,"Max Lookback Period")

// EMA and SMA Background Inputs
useStoch    = input(false, "Use Stochastic Strategy, choose only one")
StochInfo   = input(true, "Stochastic Strategy Inputs")
smoothK     = input(3, "K", minval=1)
smoothD     = input(3, "D", minval=1)
k_mode      = input("SMA", "K Mode", options=["SMA", "EMA", "WMA"])
high_source = input(high,"High Source")
low_source= input(low,"Low Source")
HTF = input("","Curernt or Higher time frame only", type=input.resolution)

// Selections to show or hide the overlays
showZones = input(true, title="Show Bullish/Bearish Zones")
showStoch = input(true, title="Show Stochastic Overlays")
showRSIBS = input(true, title="Show RSI Buy Sell Zones")
showMACD = input(true, title="Show MACD")
color_bars=input(true, "Color Bars")


// ------------------ Dynamic RSI Calculation ----------------------------------------

AvgHigh(src,cnt,val) =>
    total = 0.0
    count = 0
    for i = 0 to cnt
        if src[i] > val
            count := count + 1
            total := total + src[i]
    round(total / count)
    
RSI_high = AvgHigh(RSI, ob_lb, ob_min)

AvgLow(src,cnt,val) =>
    total = 0.0
    count = 0
    for i = 0 to cnt
        if src[i] < val
            count := count + 1
            total := total + src[i]
    round(total / count)

RSI_low = AvgLow(RSI, os_lb, os_min)


// ------------------ Price Percentage Change Calculation -----------------------------------------
perc_change(lkbk) =>
    overall_change = ((close[0] - open[lkbk]) / open[lkbk]) * 100
    highest_high = 0.0
    lowest_low = 0.0
    for i = lkbk to 0
        highest_high := i == lkbk ? high : high[i] > high[(i + 1)] ? high[i] : highest_high[1]
        lowest_low := i == lkbk ? low : low[i] < low[(i + 1)] ? low[i] : lowest_low[1]
    
    start_to_high = ((highest_high - open[lkbk]) / open[lkbk]) * 100
    start_to_low = ((lowest_low - open[lkbk]) / open[lkbk]) * 100
    previous_to_high = ((highest_high - open[1])/open[1])*100
    previous_to_low = ((lowest_low-open[1])/open[1])*100
    previous_bar = ((close[1]-open[1])/open[1])*100
    
    [overall_change, start_to_high, start_to_low, previous_to_high, previous_to_low, previous_bar]
    
// Call the function    
[overall, to_high, to_low, last_high, last_low, last_bar] = perc_change(lkbk)

// Plot the function
//plot(overall*50, color=color.white, title='Overall Percentage Change', linewidth=3)
//plot(to_high*50, color=color.green,title='Percentage Change from Start to High', linewidth=2)
//plot(to_low*50, color=color.red, title='Percentage Change from Start to Low', linewidth=2)
//plot(last_high*100, color=color.teal, title="Previous to High", linewidth=2)
//plot(last_low*100, color=color.maroon, title="Previous to Close", linewidth=2)
//plot(last_bar*100, color=color.orange, title="Previous Bar", linewidth=2)
//hline(0, title='Center Line', color=color.orange, linewidth=2)

true_dip = overall < 0 and to_high > 0 and to_low < 0 and last_high > 0 and last_low < 0 and last_bar < 0
true_peak = overall > 0 and to_high > 0 and to_low > 0 and last_high > 0 and last_low < 0 and last_bar > 0

alertcondition(true_dip, title='True Dip', message='Dip')
alertcondition(true_peak, title='True Peak', message='Peak')

// ------------------ Background Colors based on EMA Indicators -----------------------------------
// Uses standard lengths of 9 and 21, if you want control delete the constant definition and uncomment the inputs
haClose(gap) => (open[gap] + high[gap] + low[gap] + close[gap]) / 4
rsi_ema = rsi(haClose(0), length)
v2 = ema(rsi_ema, length)                                                
v3 = 2 * v2 - ema(v2, length)  
emaA = ema(rsi_ema, fastLength)                                     
emaFast = 2 * emaA - ema(emaA, fastLength)
emaB = ema(rsi_ema, slowLength)                                     
emaSlow = 2 * emaB - ema(emaB, slowLength) 

//plot(rsi_ema, color=color.white, title='RSI EMA', linewidth=3)
//plot(v2, color=color.green,title='v2', linewidth=2)
//plot(v3, color=color.red, title='v3', linewidth=2)
//plot(emaFast, color=color.teal, title="EMA Fast", linewidth=2)
//plot(emaSlow, color=color.maroon, title="EMA Slow", linewidth=2)

EMABuy = crossunder(emaFast, v2) and window()
EMASell = crossover(emaFast, emaSlow) and window()


alertcondition(EMABuy, title='EMA Buy', message='EMA Buy Condition')
alertcondition(EMASell, title='EMA Sell', message='EMA Sell Condition')


// bullish signal rule: 
bullishRule =emaFast > emaSlow
// bearish signal rule: 
bearishRule =emaFast < emaSlow

// current trading State
ruleState = 0
ruleState := bullishRule ? 1 : bearishRule ? -1 : nz(ruleState[1])
ruleColor = ruleState==1 ? color.new(color.blue, 90) : ruleState == -1 ? color.new(color.red, 90) : ruleState == 0 ? color.new(color.gray, 90) : na
bgcolor(showZones ? ruleColor : na, title="Bullish/Bearish Zones")


// ------------------  Stochastic Indicator Overlay -----------------------------------------------

// Calculation
// Use highest highs and lowest lows
h_high = highest(high_source ,lkbk)
l_low = lowest(low_source ,lkbk)

stoch = stoch(RSI, RSI_high, RSI_low, length)
k =
 k_mode=="EMA" ? ema(stoch, smoothK) :
 k_mode=="WMA" ? wma(stoch, smoothK) :
 sma(stoch, smoothK)
d = sma(k, smoothD)
k_c = change(k)
d_c = change(d)
kd = k - d

// Plot
signalColor = k>oversold and d<overbought and k>d and k_c>0 and d_c>0 ? kcolor : 
 k<overbought and d>oversold and k<d and k_c<0 and d_c<0 ? dcolor : na
kp = plot(showStoch ? k : na, "K", color=kcolor)
dp = plot(showStoch ? d : na, "D", color=dcolor)
fill(kp, dp, color = signalColor, title="K-D")
signalUp = showStoch ? not na(signalColor) and kd>0 : na
signalDown = showStoch ? not na(signalColor) and kd<0 : na
//plot(signalUp ? kd : na, "Signal Up", color=kcolor, transp=90, style=plot.style_columns)
//plot(signalDown ? (kd+100) : na , "Signal Down", color=dcolor, transp=90, style=plot.style_columns, histbase=100)

//StochBuy = crossover(k, d) and kd>0 and to_low<0 and window()
//StochSell = crossunder(k,d) and kd<0 and to_high>0 and window()

StochBuy = crossover(k, d) and window()
StochSell = crossunder(k, d) and window()

alertcondition(StochBuy, title='Stoch Buy', message='K Crossing D')
alertcondition(StochSell, title='Stoch Sell', message='D Crossing K')


// -------------- Add Price Movement -------------------------
// Calculations
h1 = vwma(high, length)
l1 = vwma(low, length)
hp = h_high[1]
lp = l_low[1]

// Plot
var plot_color=#353535
var sig = 0
if (h1 >hp)
    sig:=1
    plot_color:=color.lime
else if (l1 <lp)
    sig:=-1
    plot_color:=color.maroon
//plot(1,title = "Price Movement Bars", style=plot.style_columns,color=plot_color)
//plot(sig,title="Signal 1 or -1",display=display.none)


// --------------------------------------- RSI Plot ----------------------------------------------
// Plot Oversold and Overbought Lines
over = hline(oversold, title="Oversold", color=color.green)
under = hline(overbought, title="Overbought", color=color.red)
fillcolor = color.new(#9915FF, 90)
fill(over, under, fillcolor, title="Band Background")


// Show RSI and EMA crosses with arrows and RSI Color (tweaked Connors RSI)
// Improves strategy setting ease by showing where EMA 5 crosses EMA 10 from above to confirm overbought conditions or trend reversals
// This shows where you should enter shorts or exit longs

// Tweaked Connors RSI Calculation
connor_ob = overbought
connor_os = oversold
ma1 = sma(close,cl1)
ma2 = sma(close, cl2)
ma3 = sma(close, cl3)

// Buy Sell Zones using tweaked Connors RSI (RSI values of 80 and 20 for Crypto as well as ma3, ma20, and ma50 are the tweaks)
RSI_SELL = ma1 > ma2 and open > ma3 and RSI >= connor_ob and true_peak and window()
RSI_BUY = ma2 < ma3 and ma3 > close and RSI <= connor_os and true_dip and window()

alertcondition(RSI_BUY, title='Connors Buy', message='Connors RSI Buy')
alertcondition(RSI_SELL, title='Connors Sell', message='Connors RSI Sell')

// Color Definition
col = useCRSI ? (close > ma2 and close < ma3 and RSI <= connor_os ? color.lime : close < ma2 and close > ma3 and RSI <= connor_ob ? color.red : color.yellow ) : color.yellow

// Plot colored RSI Line
plot(RSI, title="RSI", linewidth=3, color=col)


//------------------- MACD Strategy -------------------------------------------------
[macdLine, signalLine, _] = macd(close, fastLength, slowLength, length)

bartrendcolor = macdLine > signalLine and k > 50 and RSI > 50 ? color.teal : macdLine < signalLine and k < 50 and RSI < 50 ? color.maroon : macdLine < signalLine ? color.yellow : color.gray
barcolor(color = color_bars ? bartrendcolor : na)


MACDBuy = macdLine>signalLine and RSI<RSI_low and overall<0 and window()
MACDSell = macdLine<signalLine and RSI>RSI_high and overall>0 and window()

//plotshape(showMACD ? MACDBuy: na, title = "MACD Buy", style = shape.arrowup, text = "MACD Buy", color=color.green, textcolor=color.green, size=size.small)
//plotshape(showMACD ? MACDSell: na, title = "MACD Sell", style = shape.arrowdown, text = "MACD Sell", color=color.red, textcolor=color.red, size=size.small)
MACColor = MACDBuy ? color.new(color.teal, 50) : MACDSell ? color.new(color.maroon, 50) : na
bgcolor(showMACD ? MACColor : na, title ="MACD Signals")


// -------------------------------- Entry and Exit Logic ------------------------------------


// Entry Logic
XRSI_OB = crossunder(RSI, overbought) and overall<0 and window()
RSI_OB = RSI>overbought and true_peak and window()
XRSI_OS = crossover(RSI, oversold) and overall>0 and window()
RSI_OS = RSI<oversold and true_dip and window()

alertcondition(XRSI_OB, title='Reverse RSI Sell', message='RSI Crossing back under OB')
alertcondition(XRSI_OS, title='Reverse RSI Buy', message='RSI Crossing back over OS')

alertcondition(RSI_OS, title='RSI Buy', message='RSI Crossover OS')
alertcondition(RSI_SELL, title='RSI Sell', message='RSI Crossunder OB')


// Strategy Entry and Exit with built in Risk Management
GoLong = strategy.position_size==0 and strat_val > -1 and rsi_ema > RSI and k < d ? (useXRSI ? XRSI_OS : useMACD ? MACDBuy : useCRSI ? RSI_BUY : useStoch ? StochBuy : RSI_OS) : false

GoShort = strategy.position_size==0 and strat_val < 1 and rsi_ema < RSI and d < k ? (useXRSI ? XRSI_OB : useMACD ? MACDSell : useCRSI ? RSI_SELL : useStoch ? StochSell : RSI_OB) : false

if (GoLong)
    strategy.entry("LONG", strategy.long)

if (GoShort) 
    strategy.entry("SHORT", strategy.short)


longStopPrice  = strategy.position_avg_price * (1 - stoploss)
longTakePrice  = strategy.position_avg_price * (1 + TargetProfit)
shortStopPrice = strategy.position_avg_price * (1 + stoploss)
shortTakePrice = strategy.position_avg_price * (1 - TargetProfit)

//plot(series=(strategy.position_size > 0) ? longTakePrice : na, color=color.green, style=plot.style_circles, linewidth=3, title="Long Take Profit")
//plot(series=(strategy.position_size < 0) ? shortTakePrice : na, color=color.green, style=plot.style_circles, linewidth=3, title="Short Take Profit")
//plot(series=(strategy.position_size > 0) ? longStopPrice : na, color=color.red, style=plot.style_cross, linewidth=2, title="Long Stop Loss")
//plot(series=(strategy.position_size < 0) ? shortStopPrice : na, color=color.red, style=plot.style_cross, linewidth=2, title="Short Stop Loss")

if (strategy.position_size > 0)
    strategy.exit(id="Exit Long", from_entry = "LONG", stop = longStopPrice, limit = longTakePrice)
    
if (strategy.position_size < 0)
    strategy.exit(id="Exit Short", from_entry = "SHORT", stop = shortStopPrice, limit = shortTakePrice)


CloseLong = strat_val > -1 and strategy.position_size > 0 and rsi_ema > RSI and d > k ? (useXRSI ? XRSI_OB : useMACD ? MACDSell : useCRSI ? RSI_SELL : RSI_OB) : false

if(CloseLong)
    strategy.close("LONG")
        
CloseShort = strat_val < 1 and strategy.position_size < 0 and rsi_ema < RSI and k > d ? (useXRSI ? XRSI_OS : useMACD ? MACDBuy : useCRSI ? RSI_BUY : RSI_OS) : false

if(CloseShort)
    strategy.close("SHORT")