Strategi pengesanan ayunan jalur percuma
Gambaran keseluruhan
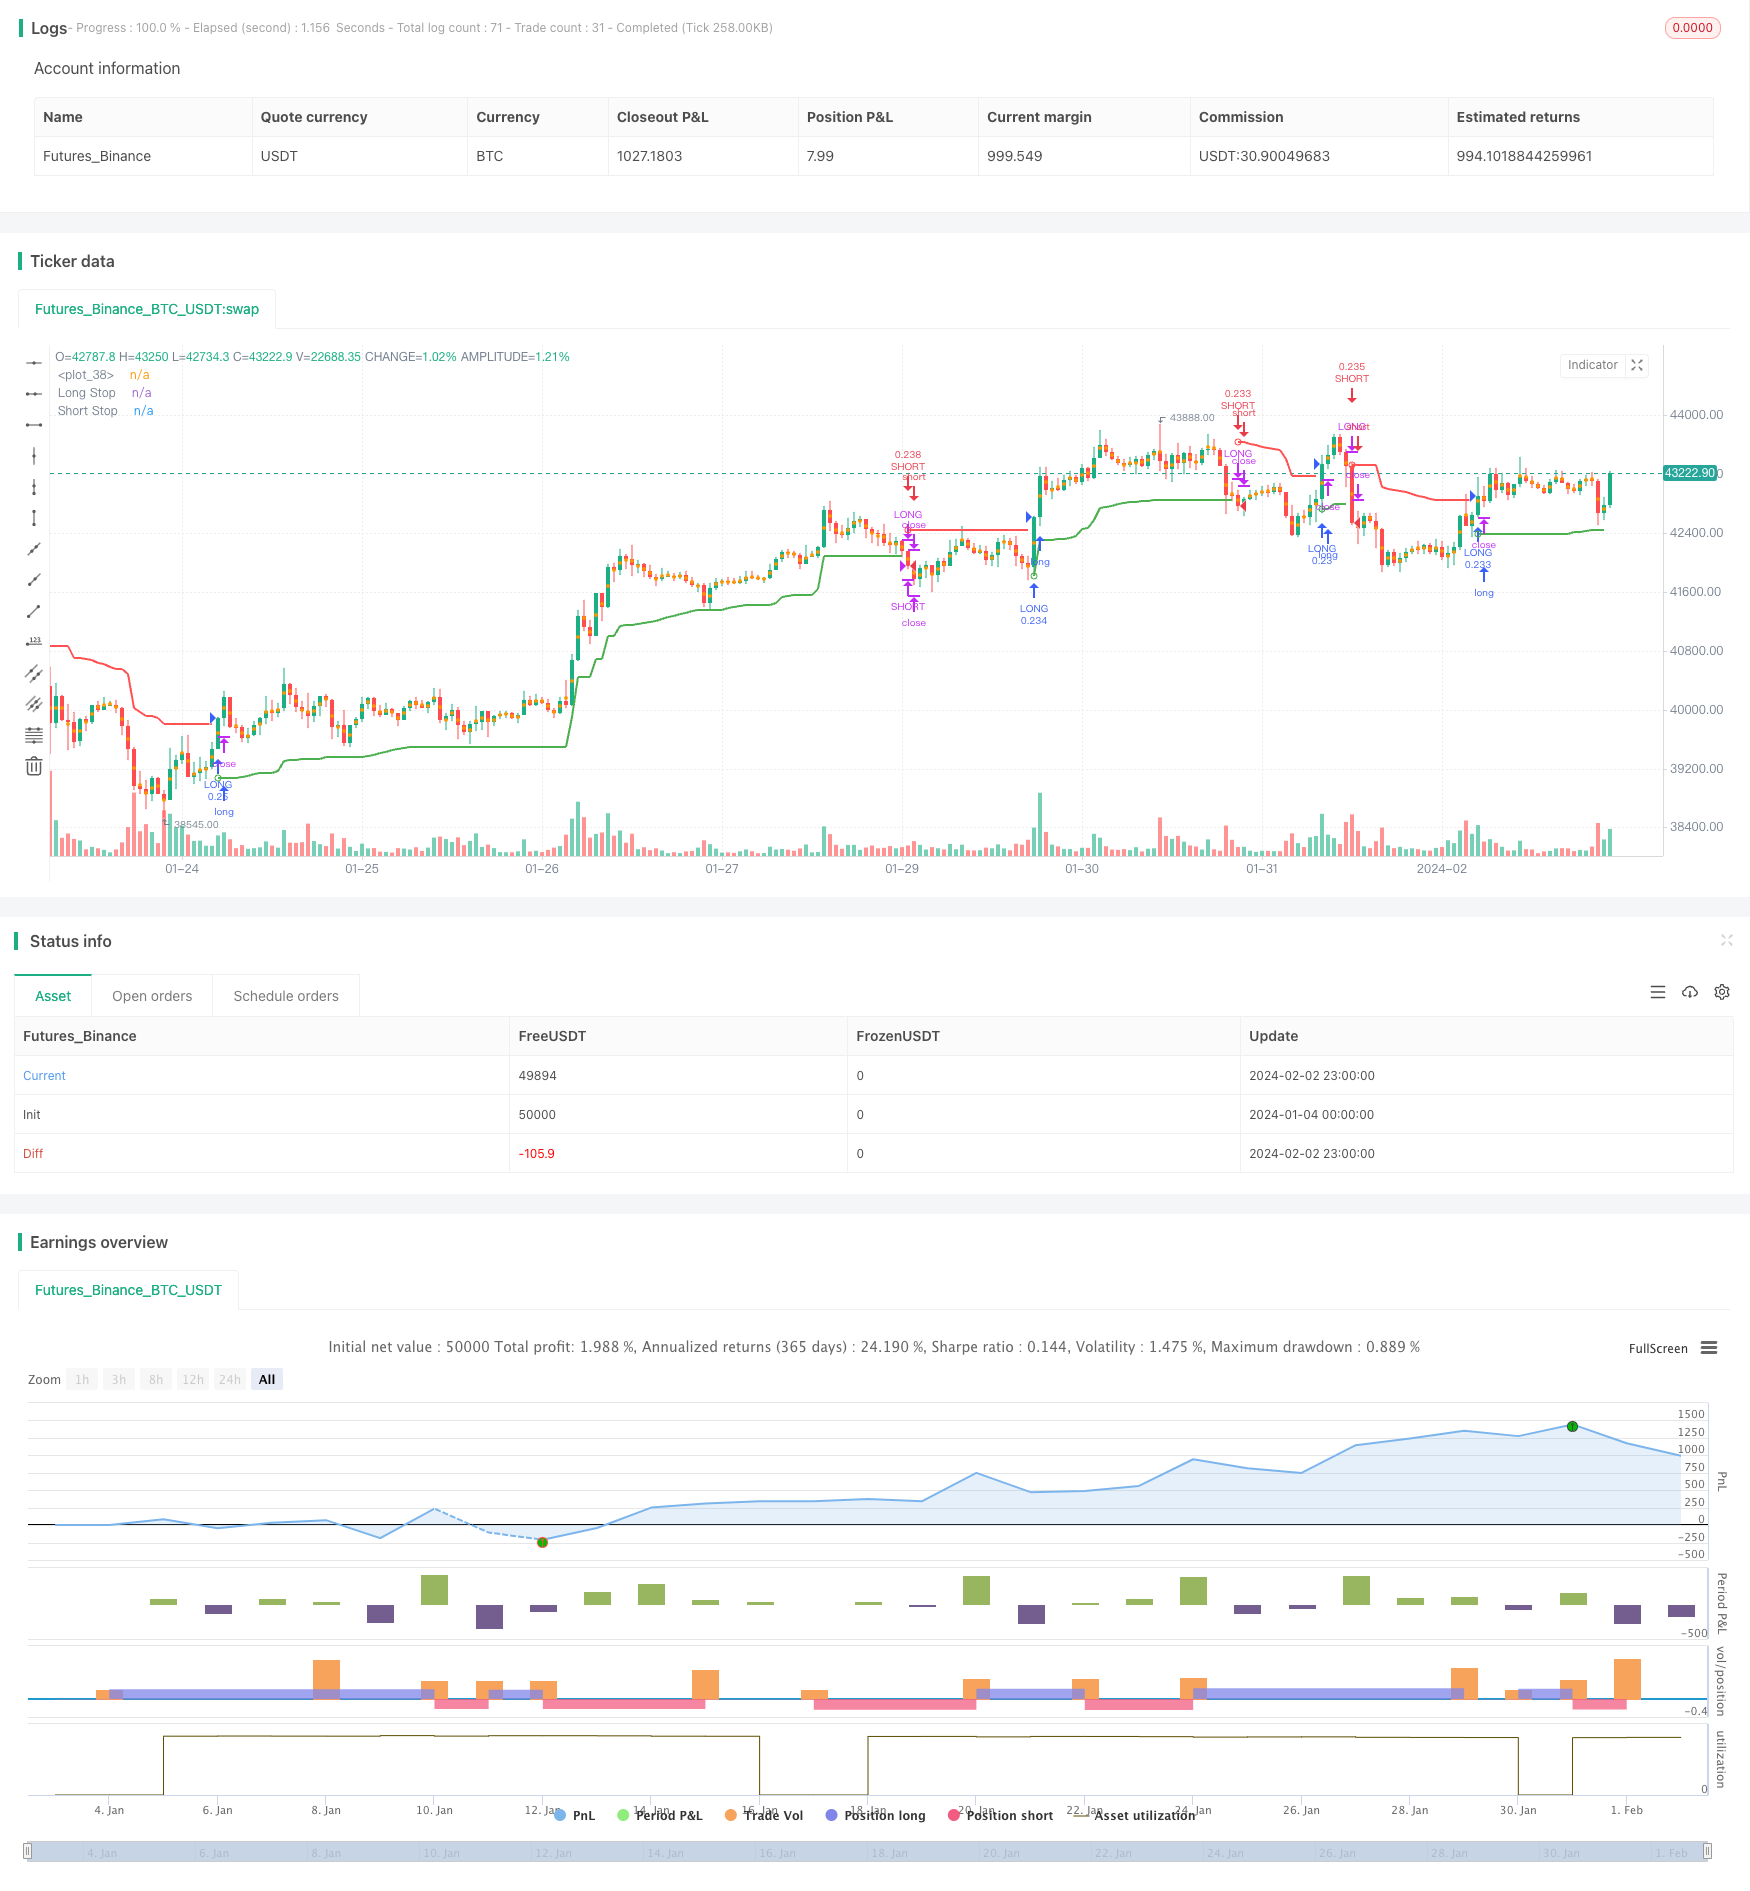
Idea utama strategi ini adalah untuk mengira titik berhenti untuk garis panjang dan garis pendek berdasarkan petunjuk ATR dan menghasilkan isyarat perdagangan apabila harga menembusi garis berhenti ini. Ia mempunyai fungsi untuk mengesan trend dan menangkap guncangan.
Prinsip Strategi
Strategi ini menggunakan ATR N-periode ATR yang diukur dengan faktor untuk mengira garis hentian yang panjang dan panjang di kedua-dua belah pihak. Rumus pengiraan khusus adalah seperti berikut:
长线止损 = 最高价 - ATR * 系数
短线止损 = 最低价 + ATR * 系数
Apabila harga naik melepasi garisan berhenti panjang, buatlah lebih banyak, apabila harga turun melepasi garisan berhenti pendek, buatlah lebih sedikit. Selepas melakukan lebih banyak, ia akan mengesan pergerakan harga dalam masa nyata untuk menggerakkan garisan berhenti.
Kaedah ini menggunakan jalur gelombang ATR sebagai tetapan stop loss, dapat menangkap trend harga dengan baik dengan mengamankan risiko stop loss. Ia memberi isyarat apabila harga mengalami penembusan yang lebih besar, yang dapat menghapuskan penembusan palsu dengan berkesan.
Analisis kelebihan
Kelebihan utama strategi ini ialah anda boleh menyesuaikan stop loss secara automatik, menangkap trend harga dan mengawal risiko. Kelebihan khusus adalah:
Berdasarkan penunjuk ATR, anda boleh menyesuaikan stop loss mengikut turun naik pasaran, dan mengawal kerugian tunggal dengan berkesan.
Dengan menggunakan cara penembusan untuk menghasilkan isyarat, ia dapat menghapuskan sebahagian daripada bunyi, dan mengelakkan ke atas dan ke bawah.
Pengaturan garis hentian dalam masa nyata untuk mengesan turun naik harga, mengelakkan hentian terlalu longgar, dan mengunci lebih banyak keuntungan.
Analisis risiko
Strategi ini juga mempunyai beberapa risiko, terutamanya tertumpu pada tetapan stop loss dan bagaimana isyarat dihasilkan. Titik risiko tertentu adalah sebagai berikut:
Kitaran ATR dan faktor yang tidak betul boleh menyebabkan stop loss terlalu lebar atau terlalu sempit.
Ia juga boleh menyebabkan penembusan pada permulaan trend.
Pengesanan Henti Kerosakan Akhir Trend mungkin terlewat dan tidak dapat keluar dengan sempurna.
Penanggulangan adalah untuk menyesuaikan parameter untuk membuat hentian lebih munasabah, atau membantu indikator lain menilai trend dan isyarat.
Arah pengoptimuman
Strategi ini boleh terus dioptimumkan dalam beberapa aspek:
Menetapkan tahap kedua untuk mengawal risiko.
Meningkatkan kualiti isyarat, digabungkan dengan petunjuk lain untuk menilai trend.
Tambah strategi hentian bergerak untuk meningkatkan keuntungan apabila trend berterusan.
Mengoptimumkan kitaran ATR dan parameter faktor untuk membuat hentian lebih dekat dengan turun naik harga sebenar.
ringkaskan
Strategi ini sangat praktikal secara keseluruhan, anda boleh secara automatik menyesuaikan stop loss untuk mengawal risiko dengan berkesan, dan anda boleh mendapatkan keuntungan yang baik melalui trend tracking. Kita boleh mengoptimumkan dan memperbaiki strategi lebih lanjut dengan menggabungkan kaedah analisis lain pada asas asal, menjadikannya lebih stabil dan lebih pintar.
/*backtest
start: 2024-01-04 00:00:00
end: 2024-02-03 00:00:00
period: 1h
basePeriod: 15m
exchanges: [{"eid":"Futures_Binance","currency":"BTC_USDT"}]
*/

// This source code is subject to the terms of the Mozilla Public License 2.0 at https://mozilla.org/MPL/2.0/
// © melihtuna
//@version=4
strategy("Chandelier Exit - Strategy",shorttitle="CE-STG" , overlay=true, default_qty_type=strategy.cash, default_qty_value=10000, initial_capital=10000, currency=currency.USD, commission_value=0.03, commission_type=strategy.commission.percent)

length = input(title="ATR Period", type=input.integer, defval=22)
mult = input(title="ATR Multiplier", type=input.float, step=0.1, defval=3.0)
showLabels = input(title="Show Buy/Sell Labels ?", type=input.bool, defval=false)
useClose = input(title="Use Close Price for Extremums ?", type=input.bool, defval=true)
highlightState = input(title="Highlight State ?", type=input.bool, defval=true)

atr = mult * atr(length)

longStop = (useClose ? highest(close, length) : highest(length)) - atr
longStopPrev = nz(longStop[1], longStop)
longStop := close[1] > longStopPrev ? max(longStop, longStopPrev) : longStop

shortStop = (useClose ? lowest(close, length) : lowest(length)) + atr
shortStopPrev = nz(shortStop[1], shortStop)
shortStop := close[1] < shortStopPrev ? min(shortStop, shortStopPrev) : shortStop

var int dir = 1
dir := close > shortStopPrev ? 1 : close < longStopPrev ? -1 : dir

var color longColor = color.green
var color shortColor = color.red

longStopPlot = plot(dir == 1 ? longStop : na, title="Long Stop", style=plot.style_linebr, linewidth=2, color=longColor)
buySignal = dir == 1 and dir[1] == -1
plotshape(buySignal ? longStop : na, title="Long Stop Start", location=location.absolute, style=shape.circle, size=size.tiny, color=longColor, transp=0)
plotshape(buySignal and showLabels ? longStop : na, title="Buy Label", text="Buy", location=location.absolute, style=shape.labelup, size=size.tiny, color=longColor, textcolor=color.white, transp=0)

shortStopPlot = plot(dir == 1 ? na : shortStop, title="Short Stop", style=plot.style_linebr, linewidth=2, color=shortColor)
sellSignal = dir == -1 and dir[1] == 1
plotshape(sellSignal ? shortStop : na, title="Short Stop Start", location=location.absolute, style=shape.circle, size=size.tiny, color=shortColor, transp=0)
plotshape(sellSignal and showLabels ? shortStop : na, title="Sell Label", text="Sell", location=location.absolute, style=shape.labeldown, size=size.tiny, color=shortColor, textcolor=color.white, transp=0)

midPricePlot = plot(ohlc4, title="", style=plot.style_circles, linewidth=0, display=display.none, editable=false)

longFillColor = highlightState ? (dir == 1 ? longColor : na) : na
shortFillColor = highlightState ? (dir == -1 ? shortColor : na) : na
fill(midPricePlot, longStopPlot, title="Long State Filling", color=longFillColor)
fill(midPricePlot, shortStopPlot, title="Short State Filling", color=shortFillColor)


long_short = input(true, "Long-Short",type=input.bool, group="Strategy Settings")

start     = input(timestamp("2019-01-01"), "Date", type=input.time, group="Strategy Settings")
finish    = input(timestamp("2025-01-01"), "Date", type=input.time, group="Strategy Settings")
window()  => true

slRatio=input(5, "Manuel Stop Loss Ratio", type=input.float, minval=0, group="Strategy Settings")
tpRatio=input(20, "Take Profit Ratio", type=input.float, minval=0, group="Strategy Settings")
tsStartRatio=input(10, "Trailing Stop Start Ratio", type=input.float, minval=0, group="Strategy Settings")
tsRatio=input(5, "Trailing Stop Ratio", type=input.float, minval=1, group="Strategy Settings")

lastBuyPrice = strategy.position_avg_price

diffHiPriceRatio = (high-lastBuyPrice)/lastBuyPrice*100
diffLoPriceRatio = (close-lastBuyPrice)/lastBuyPrice*100
posHiRatio=0.0
posHiRatio:= strategy.position_size > 0 ? diffHiPriceRatio > posHiRatio[1] ? diffHiPriceRatio : posHiRatio[1] : 0

s_diffHiPriceRatio = (low-lastBuyPrice)/lastBuyPrice*100
s_diffLoPriceRatio = (close-lastBuyPrice)/lastBuyPrice*100
s_posHiRatio=0.0
s_posHiRatio:= strategy.position_size < 0 ? s_diffLoPriceRatio < s_posHiRatio[1] ? s_diffLoPriceRatio : s_posHiRatio[1] : 0

strategy.entry("LONG", strategy.long, when = window() and buySignal)
strategy.close("LONG", when = window() and sellSignal)
strategy.close("LONG", when = diffLoPriceRatio<(slRatio*(-1)), comment="STOP-LONG")
strategy.close("LONG", when = diffHiPriceRatio>tpRatio, comment="TAKE-PROFIT-LONG")
strategy.close("LONG", when = ((posHiRatio[1]>tsStartRatio) and (posHiRatio[1]-diffHiPriceRatio)>tsRatio), comment="TRAILING-STOP-LONG")

if long_short
    strategy.entry("SHORT", strategy.short, when = window() and sellSignal)
    strategy.close("SHORT", when = window() and buySignal)
    strategy.close("SHORT", when = s_diffLoPriceRatio>(slRatio), comment="STOP-SHORT")
    strategy.close("SHORT", when = s_diffHiPriceRatio<(tpRatio*(-1)), comment="TAKE-PROFIT-SHORT")
    strategy.close("SHORT", when = ((s_posHiRatio[1]*(-1)>tsStartRatio) and ((s_posHiRatio[1]-s_diffLoPriceRatio))*(-1)>tsRatio), comment="TRAILING-STOP-SHORT")