Strategi perdagangan kuantitatif teknikal berbilang penunjuk
Gambaran keseluruhan
Strategi ini menggunakan pelbagai indikator teknikal, termasuk sistem peralihan parallax, eksport pendapat, purata bergerak sederhana, purata bergerak indeks, rata-rata bergerak, dan lain-lain, untuk mengenal pasti titik beli dan jual yang berpotensi di carta.
Prinsip Strategi
Penunjuk utama
- Sistem pengaliran garis parabola: digunakan untuk menentukan titik berhenti dan titik masuk yang berpotensi
- Strategi Eksport Opini: Untuk Menentukan Arah Trend
- Rata-rata bergerak mudah tanpa kelewatan: menyediakan rata-rata bergerak rendah dengan kelewatan
- Purata bergerak indeks: mengesan trend dan turun naik harga
- Garis rata rata: menghasilkan garis rata yang lebih halus
Isyarat dagangan
- Apabila sistem peralihan parallax menunjukkan trend ke atas dan harga melebihi purata bergerak indeks 99th, buat lebih banyak; apabila menunjukkan trend ke bawah dan harga berada di bawah purata bergerak indeks 99th, buat kosong
- Menyokong strategi eksport yang disokong oleh orang ramai untuk mengukuhkan lagi arah trend
- Garis rata yang lancar dengan isyarat garis paralisis, untuk mengelakkan penembusan palsu
Pengurusan Risiko
- Tetapkan hentian dan hentian
- Pertimbangkan untuk meletakkan semula syarat pembelian dan menyesuaikan kedudukan secara fleksibel
Analisis kelebihan
Kelebihan terbesar strategi ini adalah bahawa pelbagai indikator komprehensif, yang dapat mengenal pasti arah trend secara berkesan. Sistem garis paralisis menentukan titik-titik perubahan yang berpotensi; strategi pendapat pendapat untuk menilai trend utama; penapis isyarat palsu dengan purata bergerak. Pelbagai indikator saling mengesahkan, meningkatkan keakuratan isyarat dengan ketara.
Selain itu, strategi ini menambah mekanisme hentian dan hentian untuk mengawal risiko. Garis rata yang halus juga digunakan untuk mengelakkan gangguan bunyi jangka pendek. Ini menjadikan strategi ini stabil.
Analisis risiko
Oleh kerana bergantung kepada banyak penilaian indikator, strategi ini menghadapi kesukaran tertentu apabila indikator tersebut menghantar isyarat konflik. Selain itu, parameter yang tidak betul juga boleh memberi kesan buruk kepada perdagangan.
Di samping itu, perdagangan teknikal mempunyai risiko tertentu dan tidak dapat mengelakkan kerugian sepenuhnya. Anda perlu berhati-hati dan jangan mengikuti secara membabi buta.
Arah pengoptimuman
- Uji dan optimumkan parameter penunjuk untuk mencari kombinasi terbaik
- Menambah ketepatan isyarat dengan menggunakan model latihan data besar dengan algoritma pembelajaran mesin
- Mengambil keputusan mengenai keadaan pasaran dengan menggunakan indikator sentimen, maklumat berita, dan lain-lain, dan secara dinamik menyesuaikan kedudukan dan garis hentian
- Mengoptimumkan logik syarat pembelian semula untuk membuat pengesanan isyarat lebih fleksibel dan konsisten
ringkaskan
Strategi ini mengintegrasikan pelbagai petunjuk teknikal untuk mengenal pasti isyarat perdagangan melalui kombinasi petunjuk. Keuntungan adalah ketepatan isyarat yang tinggi dan kestabilan yang kuat. Pada masa yang sama, langkah-langkah kawalan risiko berada di tempat. Secara keseluruhan, ini adalah satu set rancangan perdagangan yang patut dipertimbangkan.
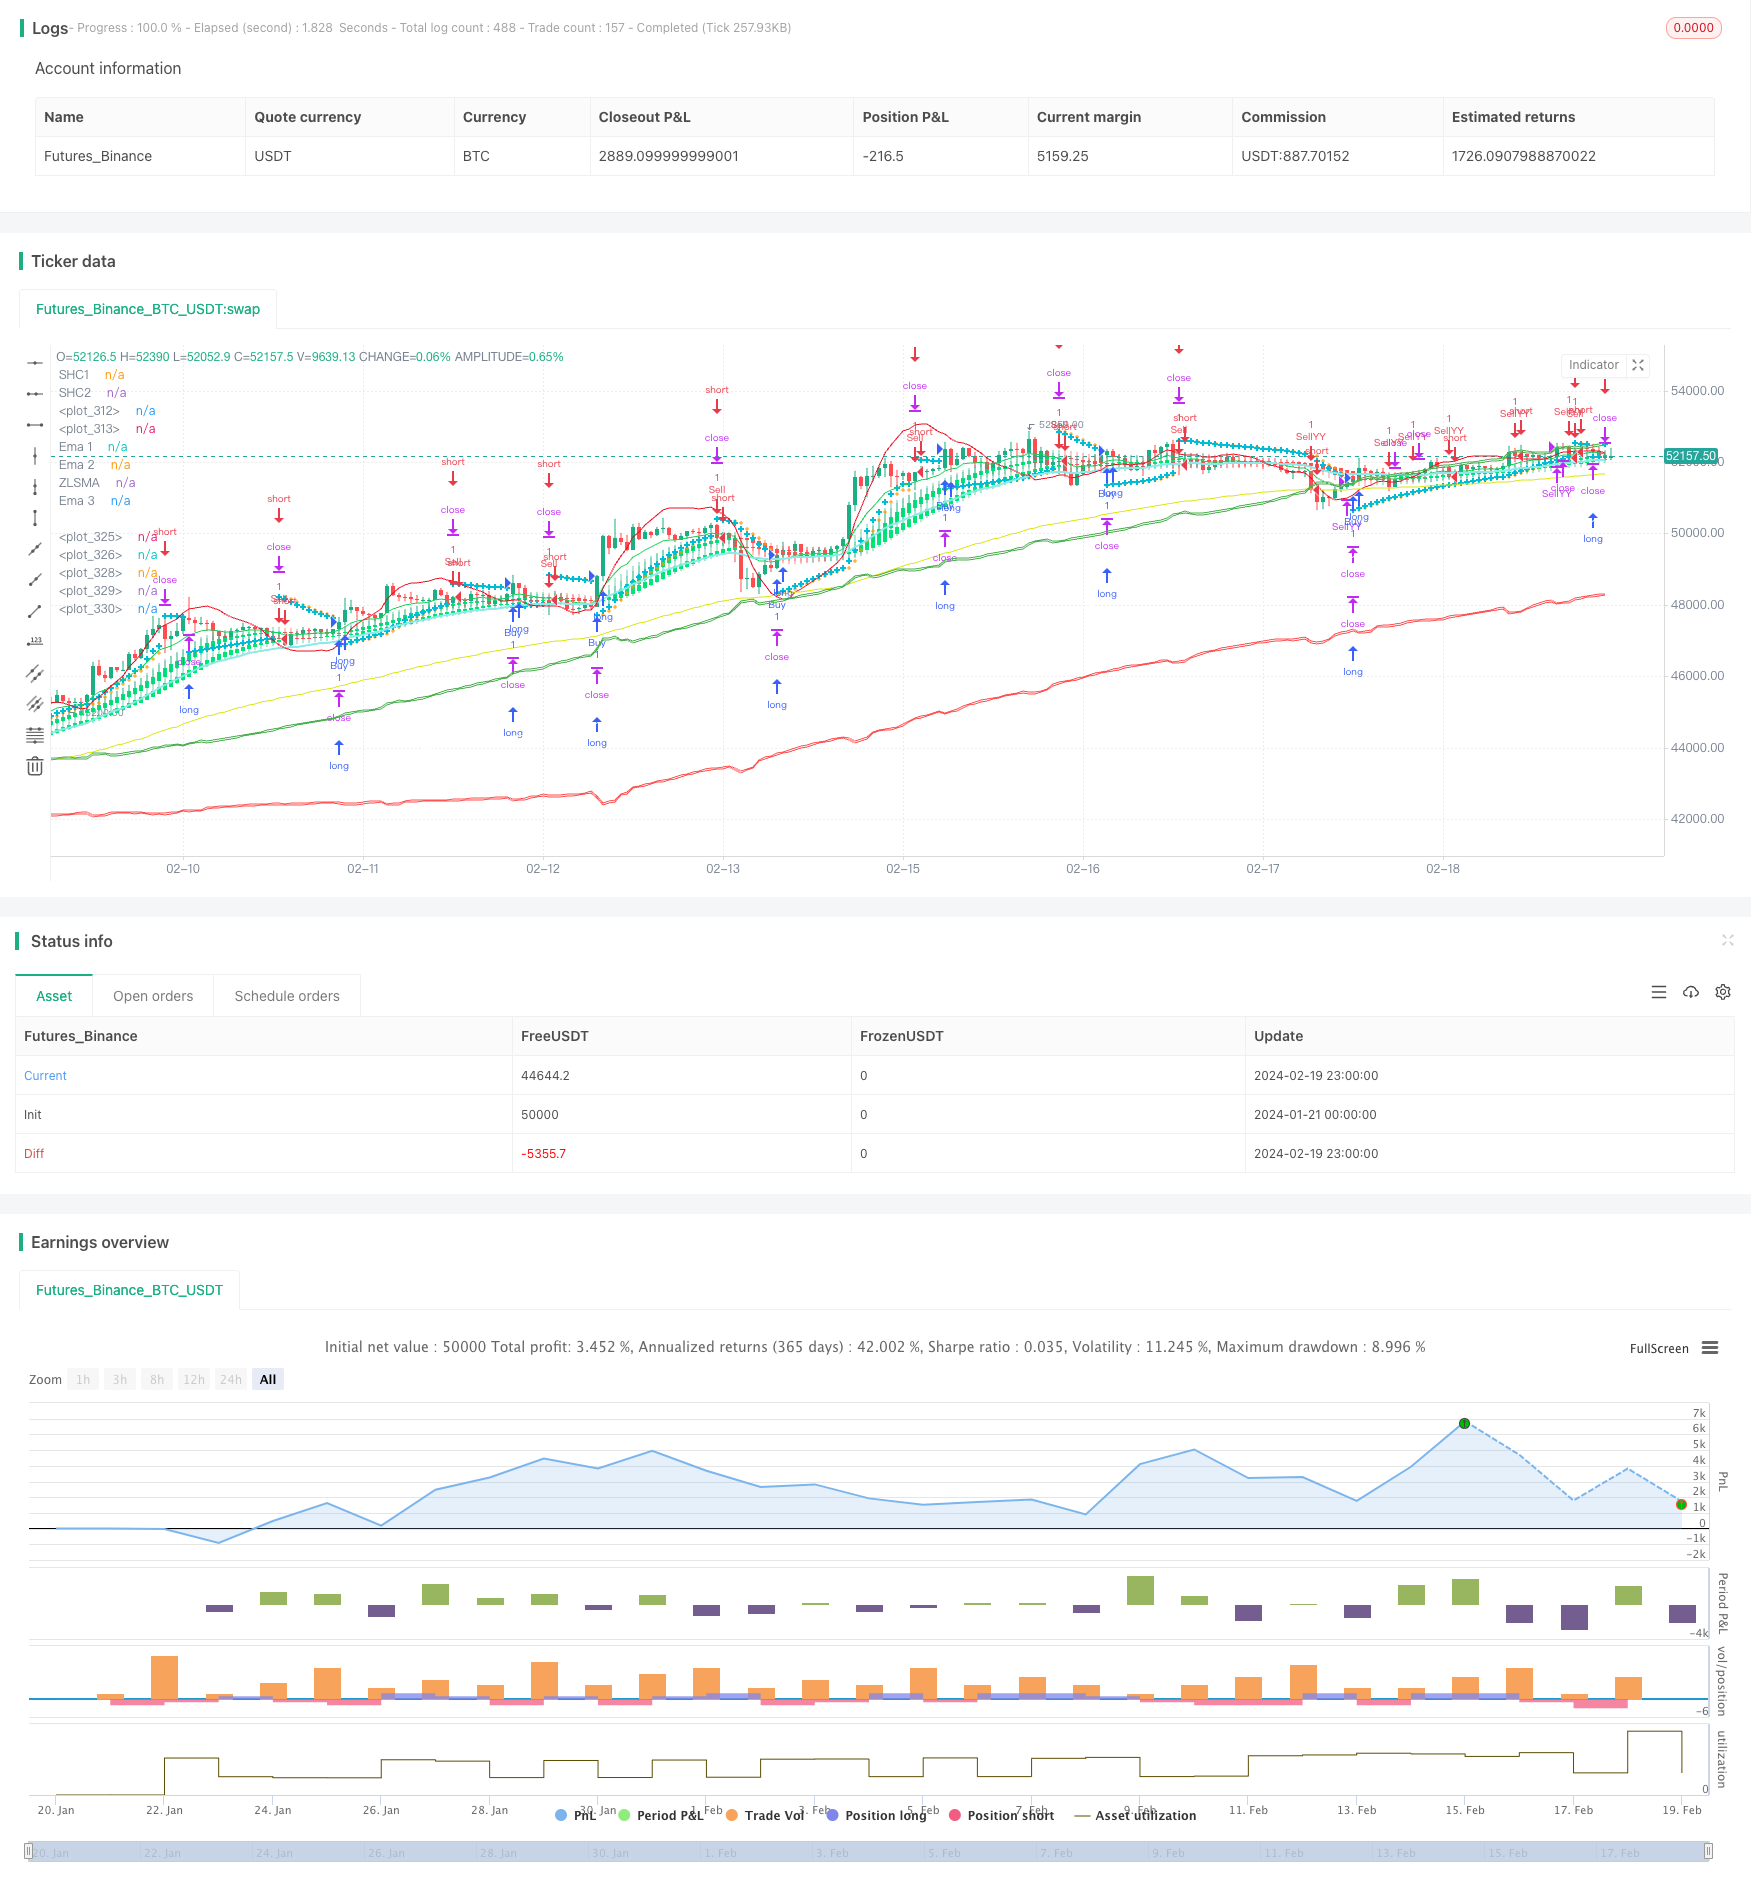
/*backtest
start: 2024-01-21 00:00:00
end: 2024-02-20 00:00:00
period: 1h
basePeriod: 15m
exchanges: [{"eid":"Futures_Binance","currency":"BTC_USDT"}]
*/


//@version=5
strategy("CE-ZLSMA-EMA-SAR-SHC", overlay=true)

// Parabolic SAR Strategy
start = input(0.02)
increment = input(0.02)
maximum = input(0.2)

var bool uptrend = na
var float EP = na
var float SAR = na
var float AF = start
var float nextBarSAR = na
var bool longSar = false
var bool shortSar = false
//input smoothed HAC 1
len=input.int(title="Length SHC1", defval = 10)
o=ta.ema(open,len)
c=ta.ema(close,len)
h=ta.ema(high,len)
l=ta.ema(low,len)

haclose = (o+h+l+c)/4
var haopen = 0.0
if na(haopen[1])
    haopen := (o + c) / 2
else
    haopen := (haopen[1] + haclose[1]) / 2


hahigh = math.max (h, math.max(haopen,haclose))
halow = math.min (l, math.min(haopen,haclose))

len2=input(10)
o2=ta.ema(haopen, len2)
c2=ta.ema(haclose, len2)
h2=ta.ema(hahigh, len2)
l2=ta.ema(halow, len2)

col=o2>c2 ? color.red : color.lime
bool shc1Green = o2 > c2
bool shc1Lime = o2 < c2
//input smoothed HAC 1
lenSHC2=input.int(title="Length SHC2 ", defval = 20)
oShc2=ta.ema(open,lenSHC2)
cShc2=ta.ema(close,lenSHC2)
hShc2=ta.ema(high,lenSHC2)
lShc2=ta.ema(low,lenSHC2)

hacloseShc2 = (oShc2+hShc2+lShc2+cShc2)/4
var haopenShc2 = 0.0
if na(haopenShc2[1])
    haopenShc2 := (oShc2 + cShc2) / 2
else
    haopenShc2 := (haopenShc2[1] + hacloseShc2[1]) / 2


hahighShc2 = math.max (hShc2, math.max(haopenShc2,hacloseShc2))
halowShc2 = math.min (lShc2, math.min(haopenShc2,hacloseShc2))

len2Shc2=input(10)
o2Shc2=ta.ema(haopenShc2, len2Shc2)
c2Shc2=ta.ema(hacloseShc2, len2Shc2)
h2Shc2=ta.ema(hahighShc2, len2Shc2)
l2Shc2=ta.ema(halowShc2, len2Shc2)

colShc2=o2Shc2>c2Shc2 ? color.red : color.lime
bool shc2Green = o2Shc2 > c2Shc2
bool shc2Lime = o2Shc2 < c2Shc2
//end smooth

bool shcGree = shc1Green and shc2Green
bool shcLime = shc1Lime and shc2Lime

//zlsma
lengthZlsma = input.int(title="Length", defval=32)
offset = input.int(title="Offset", defval=0)
src = input(close, title="Source")
lsma = ta.linreg(src, lengthZlsma, offset)
lsma2 = ta.linreg(lsma, lengthZlsma, offset)
eq= lsma-lsma2
zlsma = lsma+eq
// ema 10
len4 = input.int(10, minval=1, title="Length")
src4 = input.source(close, title="Source")
out4 = ta.ema(src4, len4)
//End of format

// ema 34
len5 = input.int(34, minval=1, title="Length")
src5 = input.source(close, title="Source")
out5 = ta.ema(src5, len5)
//end ema 34

// ema 99
len6 = input.int(99, minval=1, title="Length")
src6 = input.source(close, title="Source")
out6 = ta.ema(src6, len6)
// end ema 99

//kiem tra dieu kien gia dong cua lon hon ema99 thi moi me lenh long
bool onEma99 = close > out6
bool downEma99 = open < out6

if bar_index > 0
    firstTrendBar = false
    SAR := nextBarSAR
    if bar_index == 1
        float prevSAR = na
        float prevEP = na
        lowPrev = low[1]
        highPrev = high[1]
        closeCur = close
        closePrev = close[1]
        if closeCur > closePrev
            uptrend := true
            EP := high
            prevSAR := lowPrev
            prevEP := high
        else
            uptrend := false
            EP := low
            prevSAR := highPrev
            prevEP := low
        firstTrendBar := true
        SAR := prevSAR + start * (prevEP - prevSAR)
    if uptrend
		if SAR > low
			firstTrendBar := true
			uptrend := false
			SAR := math.max(EP, high)
			EP := low
			AF := start
	else
		if SAR < high
			firstTrendBar := true
			uptrend := true
			SAR := math.min(EP, low)
			EP := high
			AF := start
	if not firstTrendBar
		if uptrend
			if high > EP
				EP := high
				AF := math.min(AF + increment, maximum)
		else
			if low < EP
				EP := low
				AF := math.min(AF + increment, maximum)
	if uptrend
		SAR := math.min(SAR, low[1])
		if bar_index > 1
			SAR := math.min(SAR, low[2])
	else
		SAR := math.max(SAR, high[1])
		if bar_index > 1
			SAR := math.max(SAR, high[2])
	nextBarSAR := SAR + AF * (EP - SAR)
	if barstate.isconfirmed
		if uptrend
			// log.info("true")
			strategy.entry("ParSE", strategy.short, stop=nextBarSAR, comment="ParSE")
			strategy.cancel("ParLE")
			shortSar := false
			longSar := true
		else
			// log.info("false")
			strategy.entry("ParLE", strategy.long, stop=nextBarSAR, comment="ParLE")
			strategy.cancel("ParSE")
			longSar := false
			shortSar := true

// Chandelier Exit Strategy
length = input.int(title="ATR Period",  defval=1)
mult = input.float(title="ATR Multiplier",  step=0.1, defval=1.1)
showLabels = input.bool(title="Show Buy/Sell Labels ?",  defval=true)
useClose = input.bool(title="Use Close Price for Extremums ?",  defval=true)
highlightState = input.bool(title="Highlight State ?",  defval=true)

atr = mult * ta.atr(length)

longStop = (useClose ? ta.highest(close, length) : ta.highest(length)) - atr
longStopPrev = nz(longStop[1], longStop)
longStop := close[1] > longStopPrev ? math.max(longStop, longStopPrev) : longStop

shortStop = (useClose ? ta.lowest(close, length) : ta.lowest(length)) + atr
shortStopPrev = nz(shortStop[1], shortStop)
shortStop := close[1] < shortStopPrev ? math.min(shortStop, shortStopPrev) : shortStop


var int dir = 1
dir := close > shortStopPrev ? 1 : close < longStopPrev ? -1 : dir

var bool longOpened = false
var bool shortOpended = false
// Entry and exit logic
if (dir == 1)
	if longSar
		if not longOpened
			strategy.close("Sell", disable_alert = true)
    		strategy.order("Buy", strategy.long)
			longOpened := true
			shortOpended := false

if (dir == -1)
	if shortSar
		if not shortOpended
			strategy.close("Buy", disable_alert = true)
			strategy.order("Sell", strategy.short)
			shortOpended := true
			longOpened := false


//strategy YY
// ~~~~~~~~~~~ INPUTS ~~~~~~~~~~~ //
lenYY = input.int(80, "Trend Length:", tooltip="How far back should we span this indicator?\nThis length effects all lengths of the indicator")
purchaseSrc = input.source(close, "Purchase Source (Long and Short):", tooltip="What source needs to exit the purchase zone for a purchase to happen?")
exitSrc = input.source(close, "Exit Source (Long and Short):", tooltip="What source needs to hit a exit condition to stop the trade (Take profit, Stop Loss or hitting the other sides Purchase Zone)?")
useTakeProfit = input.bool(true, "Use Take Profit", tooltip="Should we take profit IF we cross the basis line and then cross it AGAIN?")
useStopLoss = input.bool(true, "Use Stop Loss", tooltip="Stop loss will ensure you don't lose too much if its a bad call")
stopLossMult = input.float(0.1, "Stoploss Multiplier %:", tooltip="How far from the purchase lines should the stop loss be")
resetCondition = input.string("Entry", "Reset Purchase Availability After:", options=["Entry", "Stop Loss", "None"],
 tooltip="If we reset after a condition is hit, this means we can purchase again when the purchase condition is met. \n" +
 "Otherwise, we will only purchase after an opposite signal has appeared.\n" +
 "Entry: means when the close enters the purchase zone (buy or sell).\n" +
 "Stop Loss: means when the close hits the stop loss location (even when were out of a trade)\n" +
 "This allows us to get more trades and also if our stop loss initally was hit but it WAS a good time to purchase, we don't lose that chance.")

// ~~~~~~~~~~~ VARIABLES ~~~~~~~~~~~ //
var bool longStart = na
var bool longAvailable = na
var bool longTakeProfitAvailable = na
var bool longStopLoss = na
var bool shortStart = na
var bool shortAvailable = na
var bool shortTakeProfitAvailable = na
var bool shortStopLoss = na

resetAfterStopLoss = resetCondition == "Stop Loss"
resetAfterEntry = resetCondition == "Entry"

// ~~~~~~~~~~~ CALCULATIONS ~~~~~~~~~~~ //
// Mid Line
midHigh = ta.vwma(ta.highest(high, lenYY), lenYY)
midLow = ta.vwma(ta.lowest(low, lenYY), lenYY)
mid = math.avg(midHigh, midLow)
midSmoothed = ta.ema(mid, lenYY)

//Volume Filtered
avgVol = ta.vwma(volume, lenYY)
volDiff = volume / avgVol
midVolSmoothed = ta.vwma(midSmoothed * volDiff, 3)

//RSI Filtered
midDifference = ta.sma(midHigh - midLow, lenYY)
midRSI = ta.rsi(midVolSmoothed, lenYY) * 0.01
midAdd = midRSI * midDifference

//Calculate Zones
purchaseZoneHigh = midSmoothed + midAdd
purchaseZoneLow = midSmoothed - midAdd
purchaseZoneBasis = math.avg(purchaseZoneHigh, purchaseZoneLow)

//Create Stop Loss Locations
stopLossHigh = purchaseZoneHigh * (1 + (stopLossMult * 0.01))
stopLossLow = purchaseZoneLow * (1 - (stopLossMult * 0.01))

// ~~~~~~~~~~~ PURCHASE CALCULATIONS ~~~~~~~~~~~ //
//Long
longEntry = ta.crossunder(purchaseSrc, purchaseZoneLow)
longStart := ta.crossover(purchaseSrc, purchaseZoneLow) and longAvailable
longAvailable := ta.crossunder(purchaseSrc, purchaseZoneHigh) or (resetAfterStopLoss and longStopLoss) or (resetAfterEntry and longEntry) ? true : longStart ? false : longAvailable[1]
longEnd = ta.crossover(exitSrc, purchaseZoneHigh)
longStopLoss := ta.crossunder(exitSrc, stopLossLow)
longTakeProfitAvailable := ta.crossover(exitSrc, purchaseZoneBasis) ? true : longEnd ? false : longTakeProfitAvailable[1]
longTakeProfit = ta.crossunder(exitSrc, purchaseZoneBasis) and longTakeProfitAvailable

//Short
shortEntry = ta.crossover(purchaseSrc, purchaseZoneHigh)
shortStart := ta.crossunder(purchaseSrc, purchaseZoneHigh) and shortAvailable
shortAvailable := ta.crossover(purchaseSrc, purchaseZoneLow) or (resetAfterStopLoss and shortStopLoss) or (resetAfterEntry and shortEntry)? true : shortStart ? false : shortAvailable[1]
shortEnd = ta.crossunder(exitSrc, purchaseZoneLow)
shortStopLoss := ta.crossover(exitSrc, stopLossHigh)
shortTakeProfitAvailable := ta.crossunder(exitSrc, purchaseZoneBasis) ? true : shortEnd ? false : shortTakeProfitAvailable[1]
shortTakeProfit = ta.crossover(exitSrc, purchaseZoneBasis) and shortTakeProfitAvailable

// ~~~~~~~~~~~ STRATEGY ~~~~~~~~~~~ //
var bool openLongYY = false
var bool openShortYY = false
if (longStart)
    strategy.order("BuyYY", strategy.long)
	strategy.close("SellYY", disable_alert = true)
	openLongYY := true
	openShortYY := false
else if (longEnd or (useStopLoss and longStopLoss) or (useTakeProfit and longTakeProfit))
    strategy.close("BuyYY", disable_alert = true)

if (shortStart)
	strategy.close("BuyYY", disable_alert = true)
    strategy.order("SellYY", strategy.short)
	openShortYY := true
	openLongYY := false
else if (shortEnd or (useStopLoss and shortStopLoss) or (useTakeProfit and shortTakeProfit))
    strategy.close("SellYY", disable_alert = true)

// ~~~~~~~~~~~ ALERTS ~~~~~~~~~~~ //
// if longStart or (longEnd or (useStopLoss and longStopLoss) or (useTakeProfit and longTakeProfit)) or shortStart or (shortEnd or (useStopLoss and shortStopLoss) or (useTakeProfit and shortTakeProfit))
//     alert("{{strategy.order.action}} | {{ticker}} | {{close}}", alert.freq_once_per_bar)

// Plotting
plot(SAR, style=plot.style_cross, linewidth=1, color=color.orange)
plot(nextBarSAR, style=plot.style_cross, linewidth=3, color=color.aqua)
plot(zlsma, color=color.rgb(235, 15, 33), linewidth=1, title = "ZLSMA")

plot(out4, color=color.rgb(24, 209, 85), title="Ema 1")
plot(out5, color=color.rgb(139, 234, 231), linewidth = 2, title="Ema 2")
plot(out6, color=color.rgb(219, 230, 18), title="Ema 3")

plotcandle(o2, h2, l2, c2, title="SHC1", color=col)
plotcandle(o2Shc2, hShc2, l2Shc2, c2Shc2, title="SHC2", color=col)


// ~~~~~~~~~~~ PLOTS YY ~~~~~~~~~~~ //
shortLine = plot(purchaseZoneHigh, color=color.green)
shortStopLossLine = plot(stopLossHigh, color=color.green) //color=color.rgb(0, 97, 3)
fill(shortLine, shortStopLossLine, color = color.new(color.green, 90))
plot(purchaseZoneBasis, color=color.white)
longLine = plot(purchaseZoneLow, color=color.red)
longStopLossLine = plot(stopLossLow, color=color.red) //color=color.rgb(105, 0, 0)
fill(longLine, longStopLossLine, color=color.new(color.red, 90))