Bollinger + RSI, Estratégia Dupla v1.1
Autora:ChaoZhang, Data: 2022-05-07 14:59:50Tags:RSI
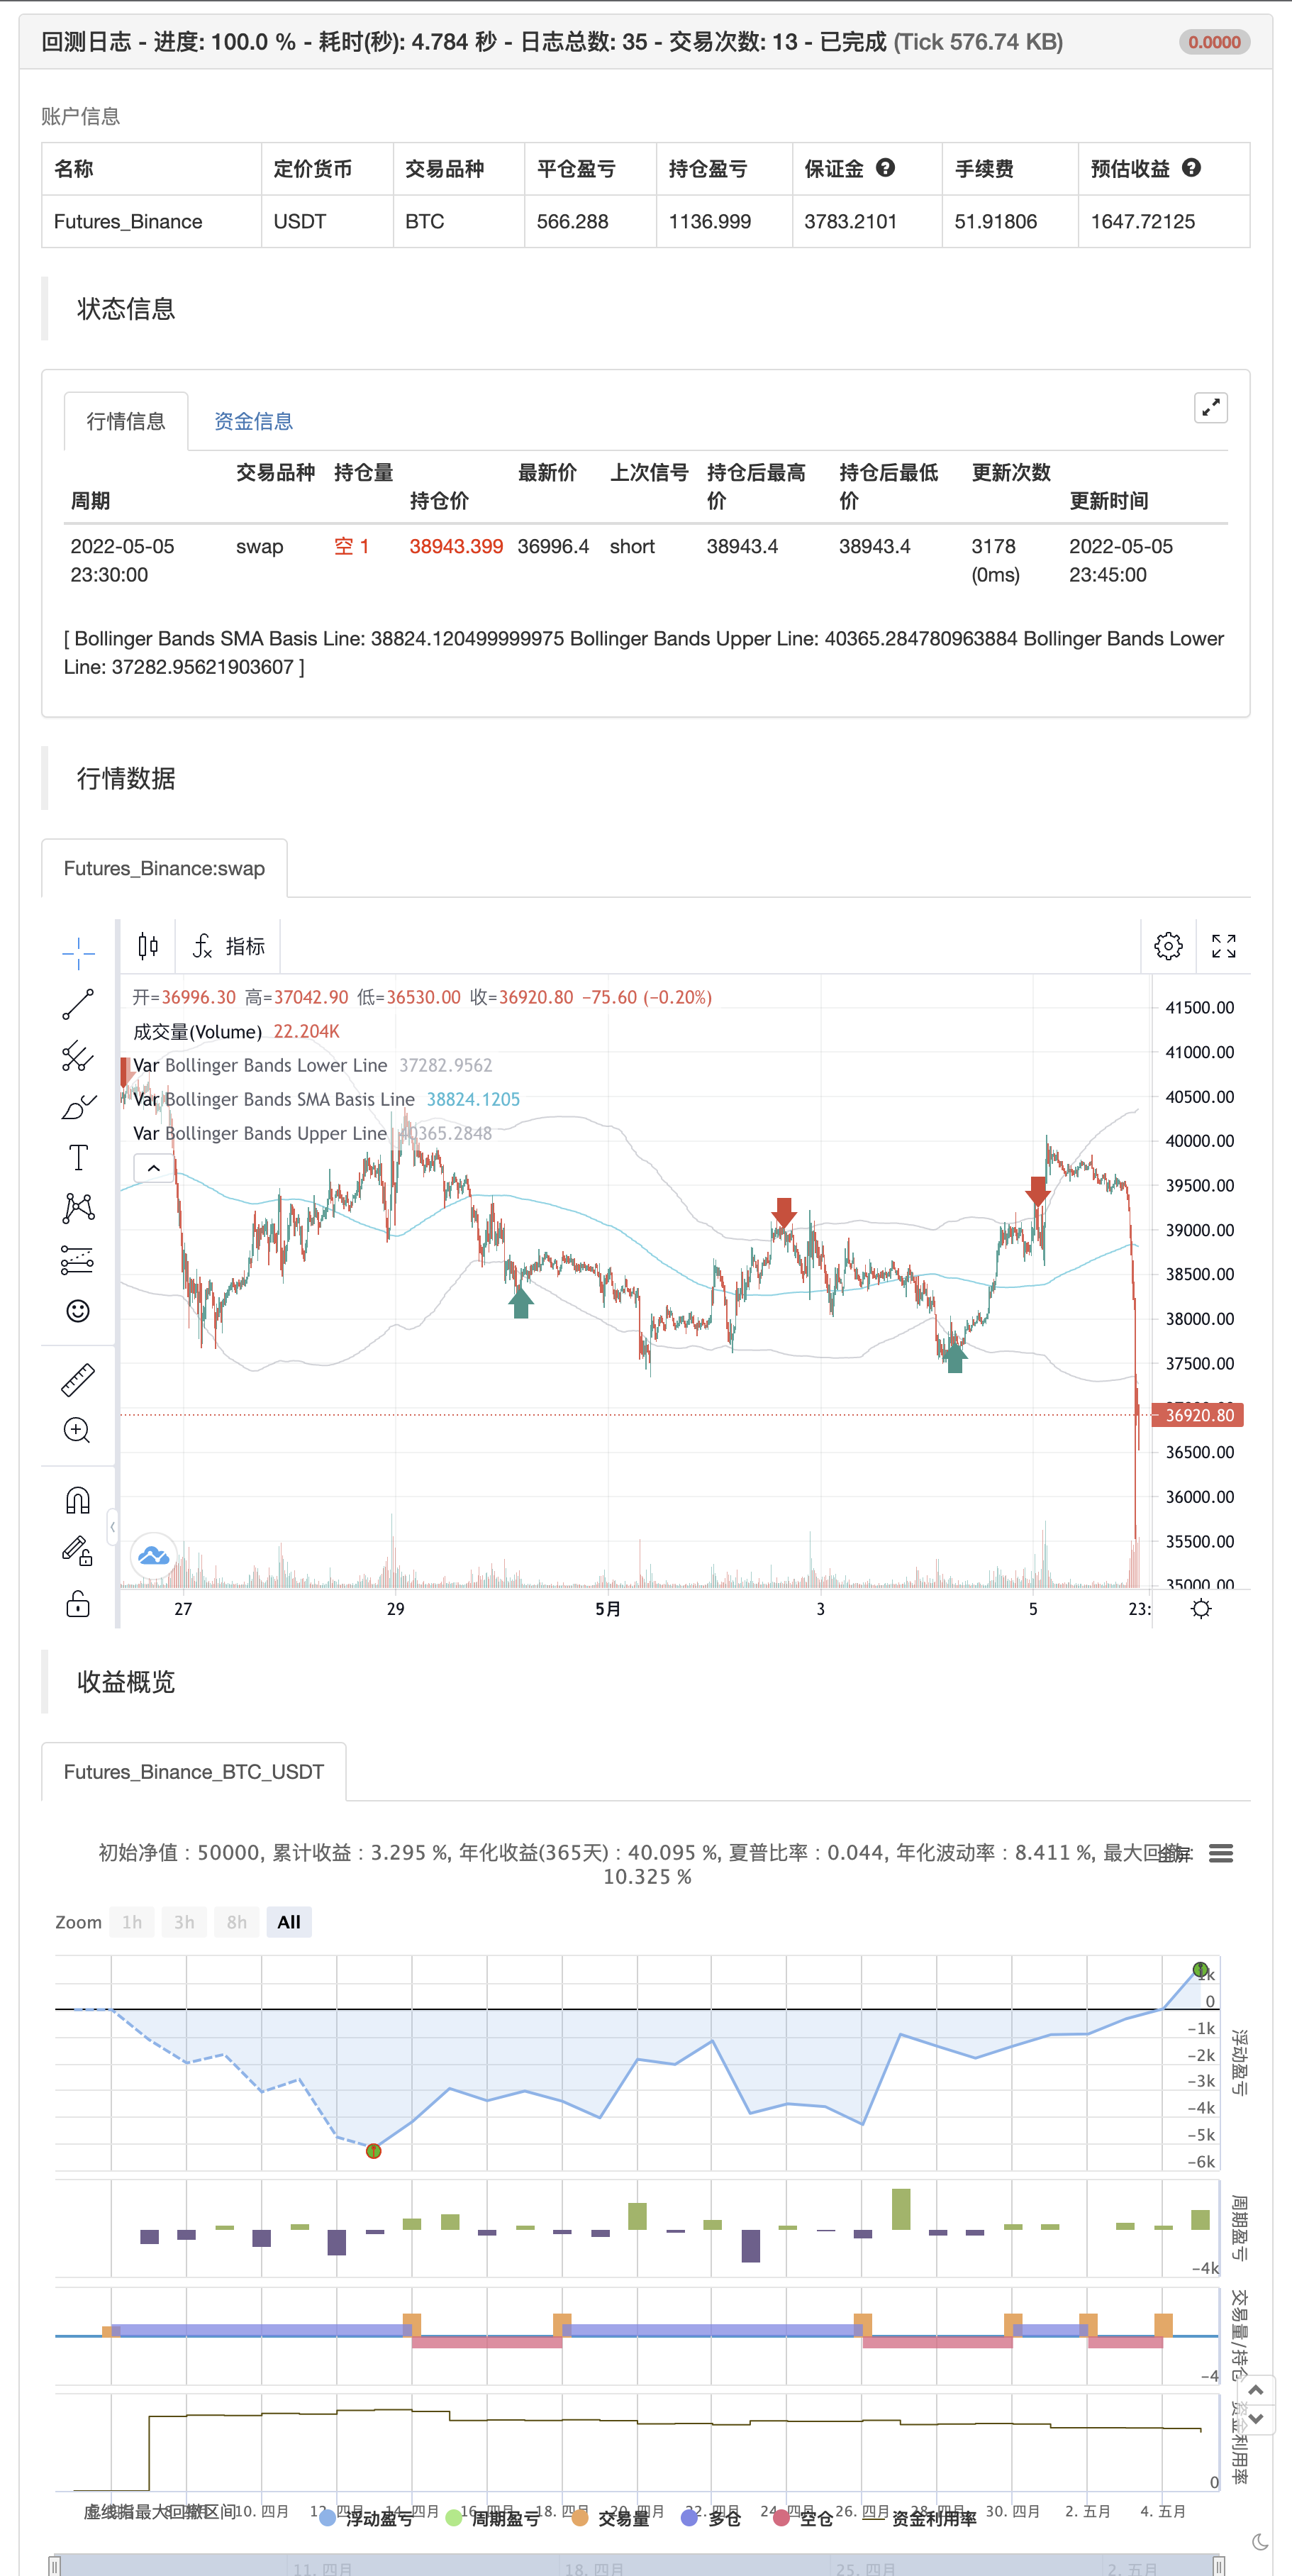
Esta estratégia usa o indicador RSI juntamente com as Bandas de Bollinger para vender quando o preço está acima da Banda de Bollinger superior (e para comprar quando este valor está abaixo da banda inferior).
ACTUALIZADONesta versão atualizada 1.1, a estratégia foi simplificada para o usuário (menos entradas) e tornou-se mais bem-sucedida no backtesting usando agora um período de 200 para o SMA, que é a base da Banda de Bollinger.
E assim como a primeira versão, esta estratégia não usa preços de fechamento a partir de um período de tempo mais longo e não deve ser repintada após o fechamento da vela atual.
Todos os negócios envolvem alto risco; o desempenho passado não é necessariamente indicativo dos resultados futuros. Os resultados de desempenho hipotéticos ou simulados têm certas limitações inerentes. Ao contrário de um registro de desempenho real, os resultados simulados não representam a negociação real. Além disso, como os negócios não foram realmente executados, os resultados podem ter sub- ou supercompensado o impacto, se houver, de certos fatores de mercado, como falta de liquidez. Os programas de negociação simulados em geral também estão sujeitos ao fato de que eles são projetados com o benefício de retrospectiva.
P.S. Para usuários avançados, se você quiser acesso a mais funções deste script estratégico, use a versão 1.0:Revisão
/*backtest
start: 2022-04-06 00:00:00
end: 2022-05-05 23:59:00
period: 15m
basePeriod: 5m
exchanges: [{"eid":"Futures_Binance","currency":"BTC_USDT"}]
*/

//@version=2
strategy("Bollinger + RSI, Double Strategy (by ChartArt) v1.1", shorttitle="CA_-_RSI_Bol_Strat_1.1", overlay=true)

// ChartArt's RSI + Bollinger Bands, Double Strategy - Update
//
// Version 1.1
// Idea by ChartArt on January 18, 2015.
//
// This strategy uses the RSI indicator
// together with the Bollinger Bands
// to sell when the price is above the
// upper Bollinger Band (and to buy when
// this value is below the lower band).
//
// This simple strategy only triggers when
// both the RSI and the Bollinger Bands
// indicators are at the same time in
// a overbought or oversold condition.
//
// In this version 1.1 the strategy was
// both simplified for the user and
// made more successful in backtesting.
//
// List of my work:
// https://www.tradingview.com/u/ChartArt/
//
//  __             __  ___       __  ___
// /  ` |__|  /\  |__)  |   /\  |__)  |
// \__, |  | /~~\ |  \  |  /~~\ |  \  |
//
//


///////////// RSI
RSIlength = input(6,title="RSI Period Length")
RSIoverSold = 50
RSIoverBought = 50
price = close
vrsi = rsi(price, RSIlength)


///////////// Bollinger Bands
BBlength = input(200, minval=1,title="Bollinger Period Length")
BBmult = 2 // input(2.0, minval=0.001, maxval=50,title="Bollinger Bands Standard Deviation")
BBbasis = sma(price, BBlength)
BBdev = BBmult * stdev(price, BBlength)
BBupper = BBbasis + BBdev
BBlower = BBbasis - BBdev
source = close
buyEntry = crossover(source, BBlower)
sellEntry = crossunder(source, BBupper)
plot(BBbasis, color=aqua,title="Bollinger Bands SMA Basis Line")
p1 = plot(BBupper, color=silver,title="Bollinger Bands Upper Line")
p2 = plot(BBlower, color=silver,title="Bollinger Bands Lower Line")
//fill(p1, p2)


///////////// Colors
switch1=input(true, title="Enable Bar Color?")
switch2=input(true, title="Enable Background Color?")
TrendColor = RSIoverBought and (price[1] > BBupper and price < BBupper) and BBbasis < BBbasis[1] ? red : RSIoverSold and (price[1] < BBlower and price > BBlower) and BBbasis > BBbasis[1] ? green : na
///barcolor(switch1?TrendColor:na)
//bgcolor(switch2?TrendColor:na,transp=50)


///////////// RSI + Bollinger Bands Strategy
if (not na(vrsi))

    if (crossover(vrsi, RSIoverSold) and crossover(source, BBlower))
        strategy.entry("RSI_BB_L", strategy.long, stop=BBlower,  comment="RSI_BB_L")

    if (crossunder(vrsi, RSIoverBought) and crossunder(source, BBupper))
        strategy.entry("RSI_BB_S", strategy.short, stop=BBupper,  comment="RSI_BB_S")

//plot(strategy.equity, title="equity", color=red, linewidth=2, style=areabr)
- MACD RSI Ichimoku Tendência de Impulso Seguindo Estratégia Longa
- Estratégia de mudança de direção do RSI
- Estratégia de negociação RSI de bandas de Bollinger aprimoradas
- Estratégia de Pivot e Momentum
- Estratégia de negociação abrangente da média móvel e do RSI
- Estratégia de recuperação de terça-feira (Filtro de fim de semana)
- Estratégia reforçada de cruzamento da EMA com o RSI/MACD/ATR
- Estratégia de negociação combinada de longo prazo do MACD e do RSI
- RSI2 Estratégia Intraday Reversal Win Rate Backtest
- Tendência de múltiplos indicadores na sequência da estratégia
- Estratégia de negociação do AlphaTradingBot
- Baguete por multigranos
- Máquina de milhares
- Indicador de inversão de K I
- Velas engolindo
- MA Imperador insicliconot
- Pontos de reversão de Demark
- Padrões de Swing Highs/Lows & Candles
- Superposição TMA
- MACD + SMA 200 Estratégia
- Sistema CM de lança
- Estratégia de bandas de Bollinger
- Rastreador de tendências otimizado
- Retorno mensal em estratégias PineScript
- ADX e DI para v4
- MacD Indicador personalizado-Frames de tempo múltiplos+Todas as opções disponíveis!
- Indicador: Oscilador de tendência de onda
- Indicador de momento de compressão
- AlphaTrend
- Negociação com vários prazos
- Oscilador de sentimentos