Estratégia de tendência do dragão voador


Data de criação: 2023-11-07 14:57:23 última modificação: 2023-11-07 14:57:23
cópia: 0 Cliques: 850
1
focar em
1621
Seguidores

Estratégia de tendência do dragão voador

Visão geral

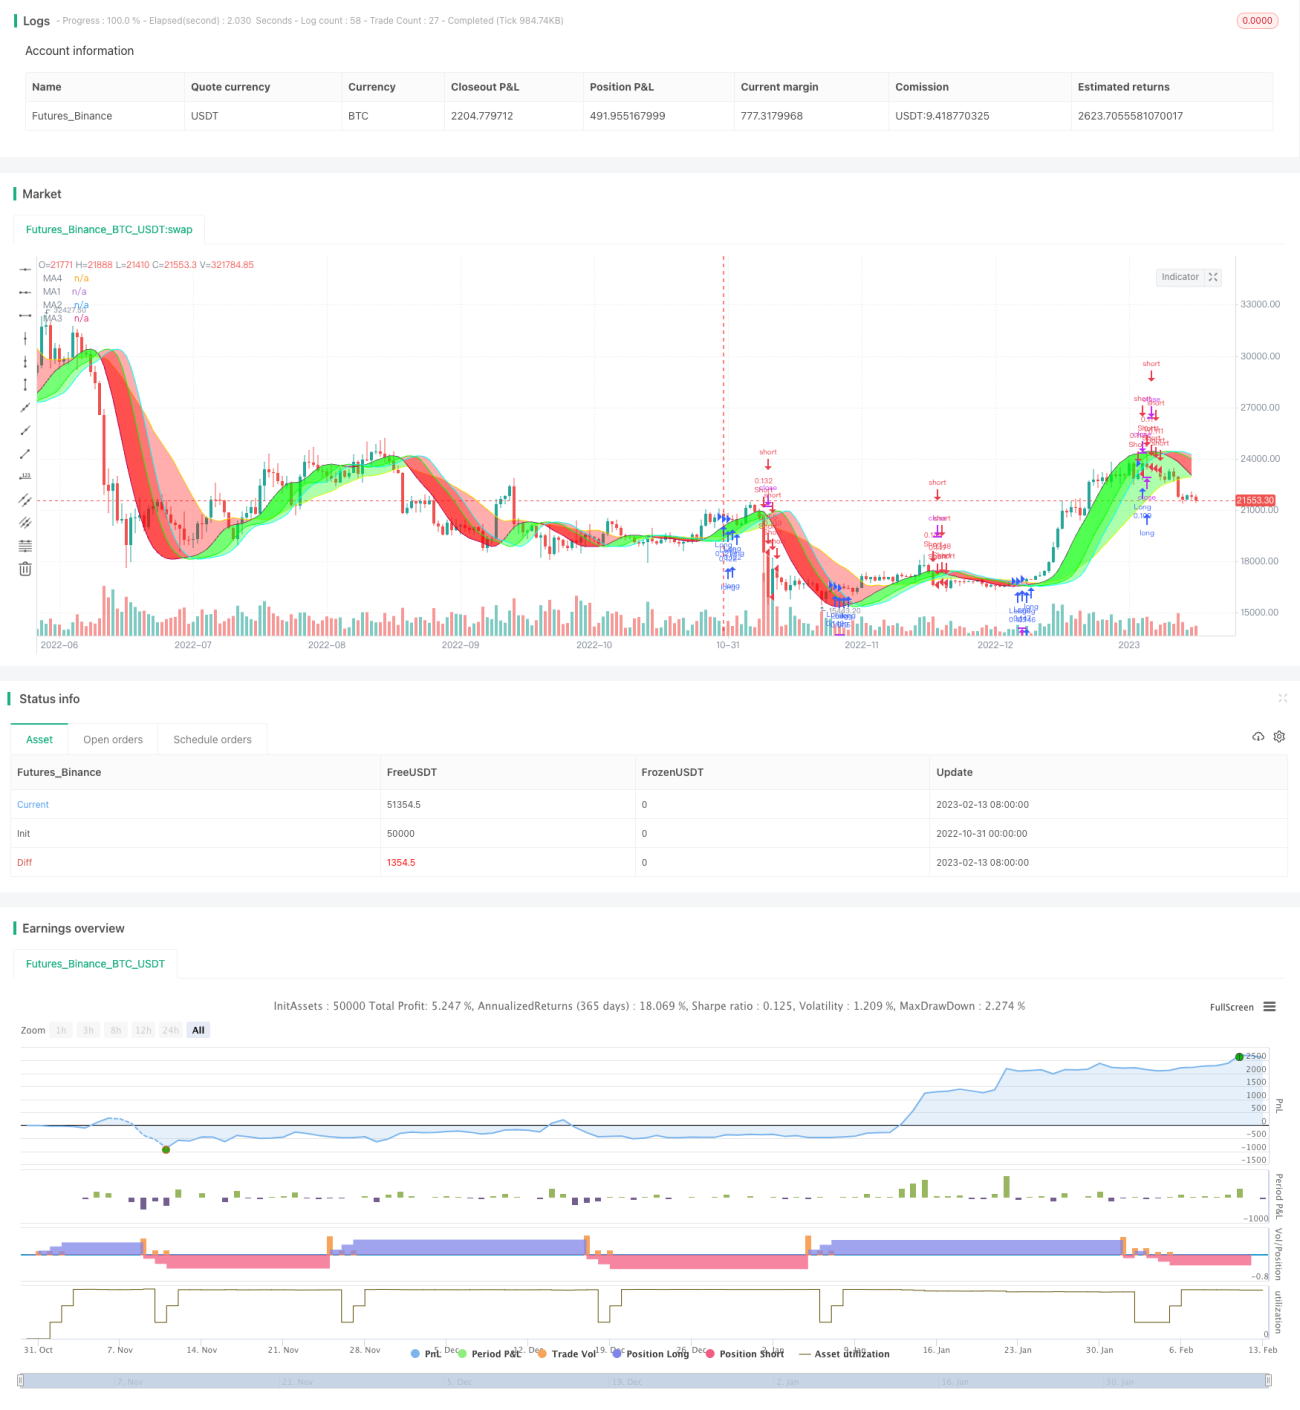
A estratégia de tendência de Falcão permite o julgamento de tendências e a geração de sinais de negociação através do ajuste do tipo, comprimento e desvio das médias móveis, traçando faixas de tendência de diferentes cores. A estratégia pode encontrar o melhor conjunto de parâmetros em diferentes períodos de tempo, equilibrando a precisão do julgamento de tendências e o risco de negociação.

Princípio da estratégia

A estratégia usa duas médias móveis para traçar as faixas de tendência, numeradas MA1 e MA4. MA1 é uma média móvel rápida, MA4 é uma média móvel lenta. Ao mesmo tempo, MA1 define 3 desvios (Offset1, Offset2, Offset3) que formam MA2 e MA3. Quando as linhas de preço atravessam diferentes médias móveis, diferentes níveis de sinais de negociação são formados.

Os usuários podem escolher entre 5 níveis de risco, com diferentes níveis de risco, atravessando diferentes médias móveis para formar um sinal de negociação, o risco de alta a baixa é: MA1 Offset1, MA2, MA3, MA4, todas as cores da faixa de tendência são consistentes. A cor da faixa de tendência indica a direção atual da tendência, verde para a tendência ascendente, vermelho para a tendência descendente.

Além disso, a estratégia permite o uso de stop loss e a opção de posições longas, curtas ou bidirecionais.

Análise de vantagens

  • É possível encontrar a melhor combinação de parâmetros em diferentes períodos de tempo, adaptando-se a um ambiente de mercado mais amplo
  • Oferece vários tipos de médias móveis opcionais que podem ser otimizadas para diferentes variedades
  • O desvio ajustável é o núcleo da estratégia, permitindo um julgamento mais preciso das tendências.
  • Níveis de risco selecionáveis para encontrar um equilíbrio entre risco e retorno
  • Muitos parâmetros podem ser combinados de forma flexível, com maior espaço para otimização
  • Uma faixa de tendência intuitiva, formando um sinal de negociação visual claro
  • Suporte a função Stop Loss para controlar o risco

Análise de Riscos

  • Em níveis de risco elevados, é fácil produzir sinais errados, devendo reduzir os níveis de risco ou ajustar os parâmetros
  • O risco de uma reversão de tendência pode levar a um bloqueio contínuo e a uma saída do mercado.
  • Diferentes variedades necessitam de testes e otimização de parâmetros separados, não todos os mesmos parâmetros podem ser aplicados
  • Quando você está negociando com altas frequências, você precisa se ajustar a uma média móvel rápida, levando a uma média móvel lenta.
  • A otimização inadequada dos parâmetros pode levar a uma otimização de testes repetidos com excesso de sensibilidade ou lentidão

O risco pode ser controlado e reduzido através da redução gradual do grau de risco, do aumento do teste de combinação de parâmetros e da otimização dos parâmetros para diferentes variedades.

Direção de otimização

  • Experimentar diferentes tipos de combinações de médias móveis
  • Teste mais parâmetros de comprimento para encontrar o melhor comprimento
  • A chave para otimizar é ajustar cuidadosamente o deslocamento.
  • Parâmetros de otimização de segmentação de acordo com diferentes variedades
  • Optimizar o ponto de parada e considerar a necessidade de parar
  • Tente um conjunto diferente de regras de abertura de posição
  • Avaliação da necessidade de otimização do filtro
  • Considerar a inclusão de indicadores de força de tendência para auxiliar

Resumir

A estratégia de tendências de Fibonacci projetou um sistema de negociação de tendências visível por meio de uma combinação inteligente de médias móveis. Os parâmetros da estratégia são ajustáveis e podem ser minuciosamente otimizados para diferentes variedades e ambientes de mercado, encontrando o melhor equilíbrio entre estabilidade e sensibilidade.

Código-fonte da estratégia
/*backtest
start: 2022-10-31 00:00:00
end: 2023-02-14 00:00:00
period: 1d
basePeriod: 1h
exchanges: [{"eid":"Futures_Binance","currency":"BTC_USDT"}]
*/

// This source code is subject to the terms of the Mozilla Public License 2.0 at https://mozilla.org/MPL/2.0/
// © MarkoP010 2023

//@version=5
//The basic idea of the strategy is to select the best set of MAs, types, lenghts and offsets, which draws red trend bands for downtrend (and green for uptrend).
//Strategy executes by selected risk level either when there is MA crossover with price (MA1 Offset1 on Highest risk level, MA2 on Low risk level) or three bands with the same color on at the same time (on Lowest risk level).
//Strategy plots user selectable Moving Average lines and a colored trend band between the MA lines. The trend bands can be turned off individually if required.
//The Offset option shifts the selected MA with the set number of steps to the right. That is where the Magic happens and the Dragon roars!

//Strategy version 1.0
strategy("Flying Dragon Trend Strategy", shorttitle="FD Trend Strategy", overlay=true, pyramiding=3, initial_capital=100000, default_qty_type=strategy.percent_of_equity, default_qty_value=5, commission_type=strategy.commission.cash_per_order, commission_value=10, calc_on_order_fills=false, process_orders_on_close=true)

strDirection = input.string(defval="Both", title="Strategy Direction", options=["Both", "Long", "Short"], group="Strategy") //Strategy direction selector by DashTrader
strSelection = strDirection == "Long" ? strategy.direction.long : strDirection == "Short" ? strategy.direction.short : strategy.direction.all //Strategy direction selector by DashTrader
strategy.risk.allow_entry_in(strSelection)

riskLevel = input.string(defval="Medium", title="Risk Level", options=["Highest", "High", "Medium", "Low", "Lowest"], tooltip="Strategy execution criteria. When Highest then MA1 Offset1 crossover with price, when Low then MA2 Offset crossover, when Lowest then all the Bands are the same color.", group="Strategy")

useStop = input(defval=false, title="Use Stop Loss", inline="SL", group="Strategy")
stopPrct = input.int(defval=10, title=" %", minval=0, maxval=100, step=1, inline="SL", group="Strategy") / 100

//Moving Averages function
MA(source, length, type) =>
    type == "EMA" ? ta.ema(source, length) :
     type == "HMA" ? ta.hma(source, length) :
     type == "RMA" ? ta.rma(source, length) :
     type == "SMA" ? ta.sma(source, length) :
     type == "SWMA" ? ta.swma(source) :
     type == "VWMA" ? ta.vwma(source, length) :
     type == "WMA" ? ta.wma(source, length) :
     na

//Inputs
ma1Type = input.string(defval="HMA", title="", inline="MA1", options=["EMA", "HMA", "RMA", "SMA","SWMA", "VWMA", "WMA"], group="Leading Moving Average") 
ma1Length = input.int(defval=35, title="",minval=1, inline="MA1", group="Leading Moving Average")
ma1Source = input(defval=close, title="", tooltip="For short timeframes, minutes to hours, instead of Default values try Lowest risk level and HMA75 with Offsets 0,1,4 and SMA12 with Offset 6.", inline="MA1", group="Leading Moving Average")
ma1Color  = input(defval=color.purple, title="", inline="MA-1", group="Leading Moving Average")
//useMa1Offset = input(defval=false, title="Use offset to MA-1", inline="MA1", group="Leading Moving Average")
ma1Offset = input.int(defval=0, title="Offset1 Steps", minval=0, maxval=10, step=1, tooltip="The Magic happens here! The offset to move the line to the right.", inline="MA-1", group="Leading Moving Average")
ma1 = MA(ma1Source, ma1Length, ma1Type)[ma1Offset]

ma2Color  = input(defval=color.lime, title="", inline="MA-2", group="Leading Moving Average")
//useMa2Offset = input(defval=true, title="Use offset to MA2", inline="MA-2", group="Leading Moving Average")
ma2Offset = input.int(defval=4, title="Offset2 Steps", minval=0, maxval=10, step=1, tooltip="The Magic happens here! The offset to move the line to the right.", inline="MA-2", group="Leading Moving Average")
ma2 = ma1[ma2Offset]

ma3Color  = input(defval=color.aqua, title="", inline="MA-3", group="Leading Moving Average")
//useMa3Offset = input(defval=false, title="Use offset to MA3", inline="MA-3", group="Leading Moving Average")
ma3Offset = input.int(defval=6, title="Offset3 Steps", minval=0, maxval=10, step=1, tooltip="The Magic happens here! The offset to move the line to the right.", inline="MA-3", group="Leading Moving Average")
ma3 = ma1[ma3Offset]

ma4Type = input.string(defval="SMA", title="", inline="MA4", options=["EMA", "HMA", "RMA", "SMA","SWMA", "VWMA", "WMA"], group="Lagging Moving Average") 
ma4Length = input.int(defval=22, title="",minval=1, inline="MA4", group="Lagging Moving Average")
ma4Source = input(defval=close, title="", inline="MA4", group="Lagging Moving Average")
ma4Color  = input(defval=color.yellow, title="", inline="MA-4", group="Lagging Moving Average")
//useMa4Offset = input(defval=true, title="Use offset to MA4", inline="MA-4", group="Lagging Moving Average")
ma4Offset = input.int(defval=2, title="Offset Steps", minval=0, maxval=10, step=1, tooltip="The Magic happens here! The offset to move the line to the right.", inline="MA-4", group="Lagging Moving Average")
ma4 = MA(ma4Source, ma4Length, ma4Type)[ma4Offset]

bandTransp = input.int(defval=60, title="Band Transparency", minval=20, maxval=80, step=10, group="Banding")
useBand1 = input(defval=true, title="Band 1", inline="Band", group="Banding")
band1Transp = useBand1 ? bandTransp : 100
band1clr = ma1 > ma2 ? color.new(#00ff00, transp=band1Transp) : color.new(#ff0000, transp=band1Transp)
useBand2 = input(defval=true, title="Band 2", inline="Band", group="Banding")
band2Transp = useBand2 ? bandTransp : 100
band2clr = ma1 > ma3 ? color.new(#00ff00, transp=band2Transp) : color.new(#ff0000, transp=band2Transp)
useBand3 = input(defval=true, title="Band 3", tooltip="Up trend green, down trend red. Colors get reversed if MA1 lenght is greater than MA2 lenght, or they are different type and MA2 quicker. In that case, just reverse your selections for MA1 and MA2, or let it be as is.", inline="Band", group="Banding")
band3Transp = useBand3 ? bandTransp : 100
band3clr = ma1 > ma4 ? color.new(#00ff00, transp=band3Transp) : color.new(#ff0000, transp=band3Transp)

//Graphs
piirto1 = plot(ma1, color = ma1Color, title="MA1")
piirto2 = plot(ma2, color = ma2Color, title="MA2")
piirto3 = plot(ma3, color = ma3Color, title="MA3")
piirto4 = plot(ma4, color = ma4Color, title="MA4")

fill(piirto1, piirto2, color=band1clr)
fill(piirto1, piirto3, color=band2clr)
fill(piirto1, piirto4, color=band3clr)

//Strategy entry and stop conditions

longCondition = riskLevel == "Highest" ? ma1Source > ma1 : riskLevel == "High" ? ma1Source > ma2 : riskLevel == "Medium" ? ma1Source > ma3 : riskLevel == "Low" ? ma1Source > ma4 : riskLevel == "Lowest" ? ma1 > ma2 and ma1 > ma3 and ma1 > ma4 : na
shortCondition = riskLevel == "Highest" ? ma1Source < ma1 : riskLevel == "High" ? ma1Source < ma2 : riskLevel == "Medium" ? ma1Source < ma3 : riskLevel == "Low" ? ma1Source < ma4 : riskLevel == "Lowest" ? ma1 < ma2 and ma1 < ma3 and ma1 < ma4 : na

stopLprice = useStop == true ? strategy.position_avg_price * (1-stopPrct) : na
stopSprice = useStop == true ? strategy.position_avg_price * (1+stopPrct) : na

if (longCondition)
    strategy.entry("Long",strategy.long)
    strategy.exit("Long Stop", "Long", stop=stopLprice)    
if (shortCondition)
    strategy.entry("Short",strategy.short)
    strategy.exit("Short Stop", "Short", stop=stopSprice)

//End