Estratégia de Momentum de Crossover de Média Móvel Dupla

Visão geral
A estratégia usa o princípio de duplo equilíbrio de linha cruzada, combinando o julgamento de tendência do indicador MACD e o cruzamento de destaque de fundo, auxiliado pelo ponto de forma, com o objetivo de capturar a tendência intermédia do mercado. A lógica principal é entrar no mercado quando a mudança ocorre na direção da linha equilánea, com o cruzamento de destaque da linha cruzada através da cor de fundo do MACD, combinando o julgamento de mudança de cor do diagrama do MACD.
Princípio da estratégia
A estratégia usa o EMA rápido e o EMA lento para construir duas linhas de equilíbrio, as linhas rápidas e lentas se cruzam para determinar a direção da tendência. Ao mesmo tempo, calcula-se o MACD e o sinal, cuja diferença é traçada como um gráfico retrógrado.
De acordo com o código, o comprimento da linha rápida é 12, o comprimento da linha lenta é 26, indicando tendências de curto e longo prazo. O comprimento do sinal é 9, para o processamento de suavização adicional.
A lógica cruzada:
- trend_up = macd > signal: linha rápida atravessa a linha lenta, representando a tendência de alta de curto prazo
- trend_dn = macd < signal: a linha rápida atravessa a linha lenta, representando uma tendência de queda a curto prazo
O ponto de interseção:
- cross_UP = signal[1] >= macd[1] and signal < macd: linha rápida atravessa a linha lenta de baixo
- cross_DN = signal[1] <= macd[1] and signal > macd: linha rápida atravessa a linha lenta de cima para baixo
A mudança de cor do diagrama vertical determina a intensidade da tendência:
- histA_IsUp = coluna de crescimento do diagrama vertical maior que 0, representando aumento de força de ascensão
- histA_IsDown = coluna do diagrama vertical menor e maior que 0, representando diminuição da força ascendente
- Compartilhe abaixo
Vantagens estratégicas
-
Usar duas linhas de equilíbrio para determinar a direção da tendência a médio prazo, evitando ser perturbado pelo ruído do mercado a curto prazo
-
Os indicadores MACD auxiliam na determinação de tendências e intensidade de curto prazo, aumentando a probabilidade de lucro
-
A variação de cor do diagrama vertical determina o tamanho da intensidade, permitindo um melhor tempo de entrada
-
Marcações de cores de fundo em pontos de cruzamento, à primeira vista
-
Ciclo linear personalizável, adaptado a diferentes cenários de mercado
-
Parâmetros MACD ajustáveis para otimizar o efeito do indicador
-
Fornece vários tipos de confirmação de entrada: direção equidistante, cruzamento de indicadores, ruptura de forma
Risco estratégico
-
A avaliação de dupla linha de equilíbrio mostra que a tendência média é insensível a flutuações de curto prazo e pode perder oportunidades de curto prazo
-
Parâmetros MACD mal definidos, indicador de mau desempenho, sinalização errada
-
Há uma certa cegueira apenas com a entrada da linha média e do sinal MACD
-
Não contemplado mecanismo de retirada de perdas, risco de expansão de perdas
-
Falta de gestão rigorosa de fundos e controlo de posições
Soluções possíveis:
-
Combinação com outros indicadores para limitar a variação a curto prazo e controlar o risco
-
Optimizar os parâmetros MACD para testar a eficácia em diferentes mercados
-
Aumentar a forma, o Momento e outros fatores confirmam o sinal
-
Estabelecer mecanismos de prevenção de perdas para evitar perdas excessivas
-
Adicionar o módulo de gestão de fundos para controlar as posições individuais de acordo com o tamanho dos fundos
Direção de otimização da estratégia
-
Testar combinações de parâmetros de linha média optimizadas para mais situações de mercado
-
Tente diferentes tipos de linha média, como VWAP, linha média de faixa de rolamento, etc.
-
Aumentar o volume de tráfego e evitar falsas brechas
-
Indicadores como o RSI confirmam o excesso de compra e venda
-
Estabelecer mecanismos de suspensão adequados, como suspensão por movimento e suspensão por vibração
-
Adesão ao mecanismo de gestão de posições, que controla as posições individuais de acordo com o tamanho do capital
-
Optimização de parâmetros em combinação com algoritmos de aprendizado de máquina
-
Expansão da estratégia Universe, aprofundamento do portfólio de investimentos
Resumir
A estratégia integra o julgamento de tendências de dupla equilíbrio e o indicador de dinâmica MACD, adicionando características de forma, para construir uma estratégia de negociação de médio prazo relativamente estável. A principal vantagem está em capturar a direção da tendência principal e evitar a interferência do ruído do mercado de curto prazo.
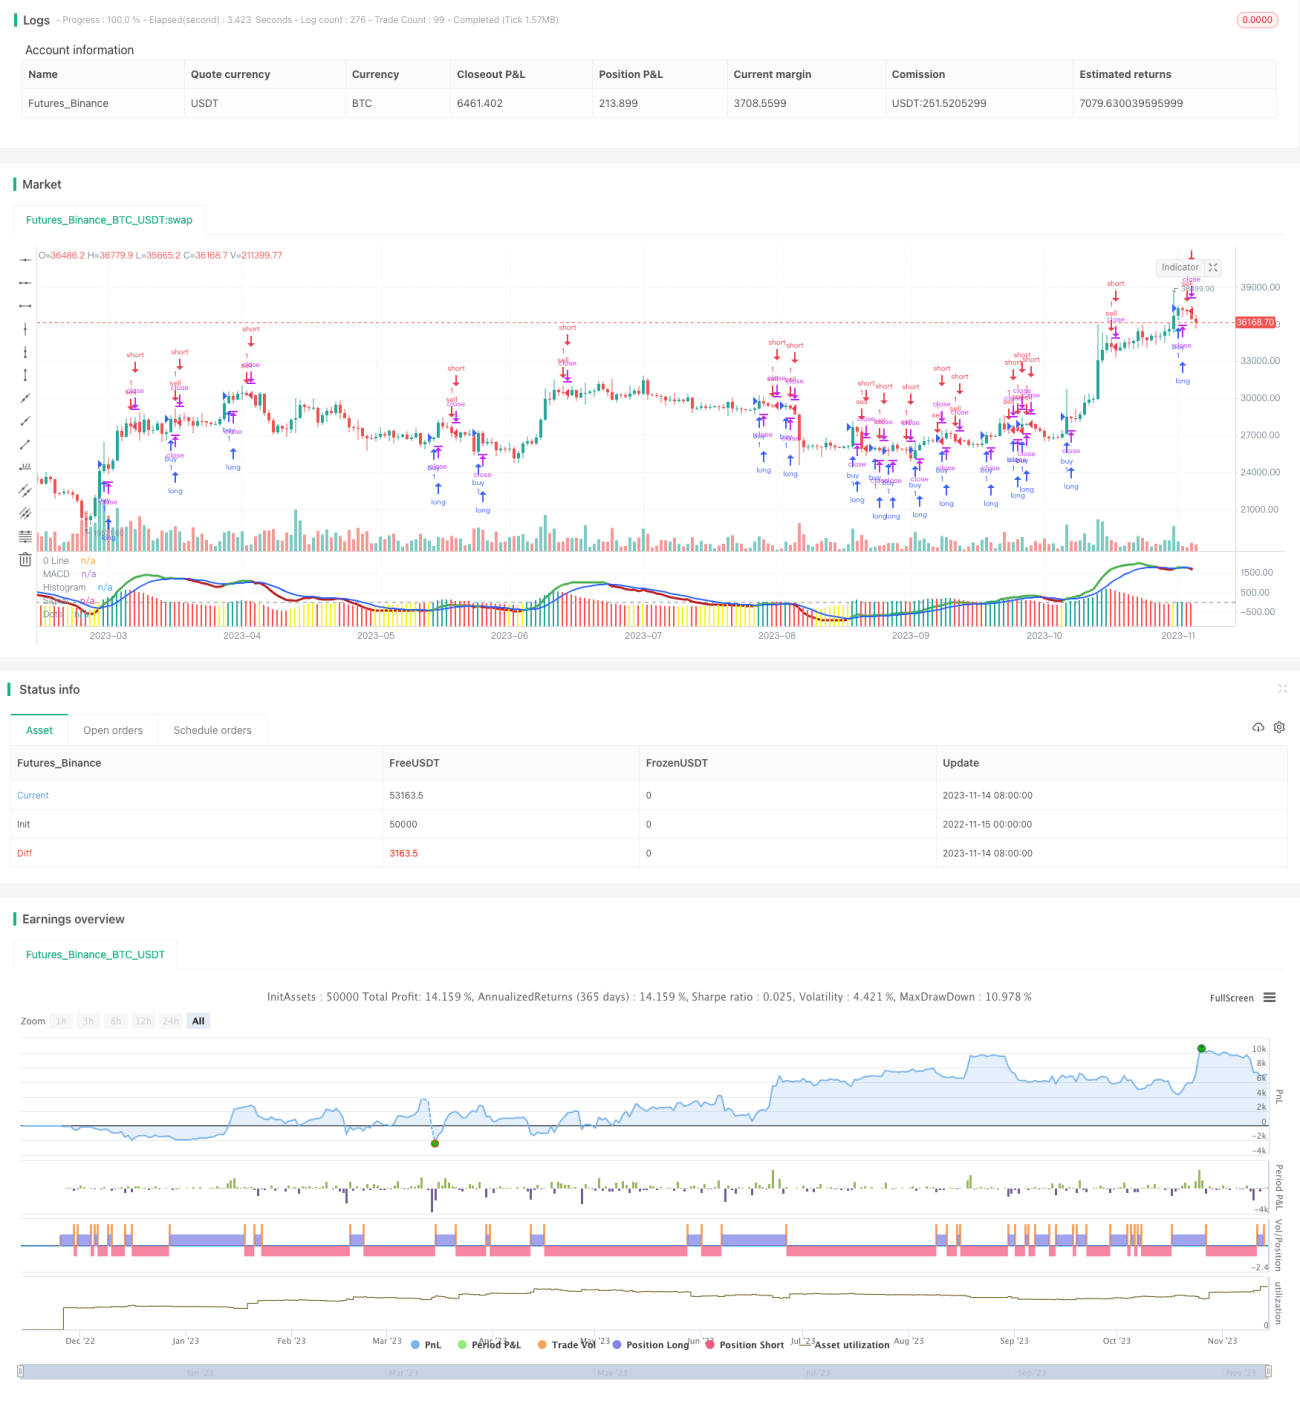
/*backtest
start: 2022-11-15 00:00:00
end: 2023-11-15 00:00:00
period: 1d
basePeriod: 1h
exchanges: [{"eid":"Futures_Binance","currency":"BTC_USDT"}]
*/

//@version=5
strategy(title="Histogram MacD MVP_V2.1", shorttitle="Histogram MacD MVP_2.1")
//Plot Inputs
res = input.timeframe("", "Indicator TimeFrame")- 1