Estratégia de rompimento de triângulo duplo do Moonlight Tracker

Visão geral
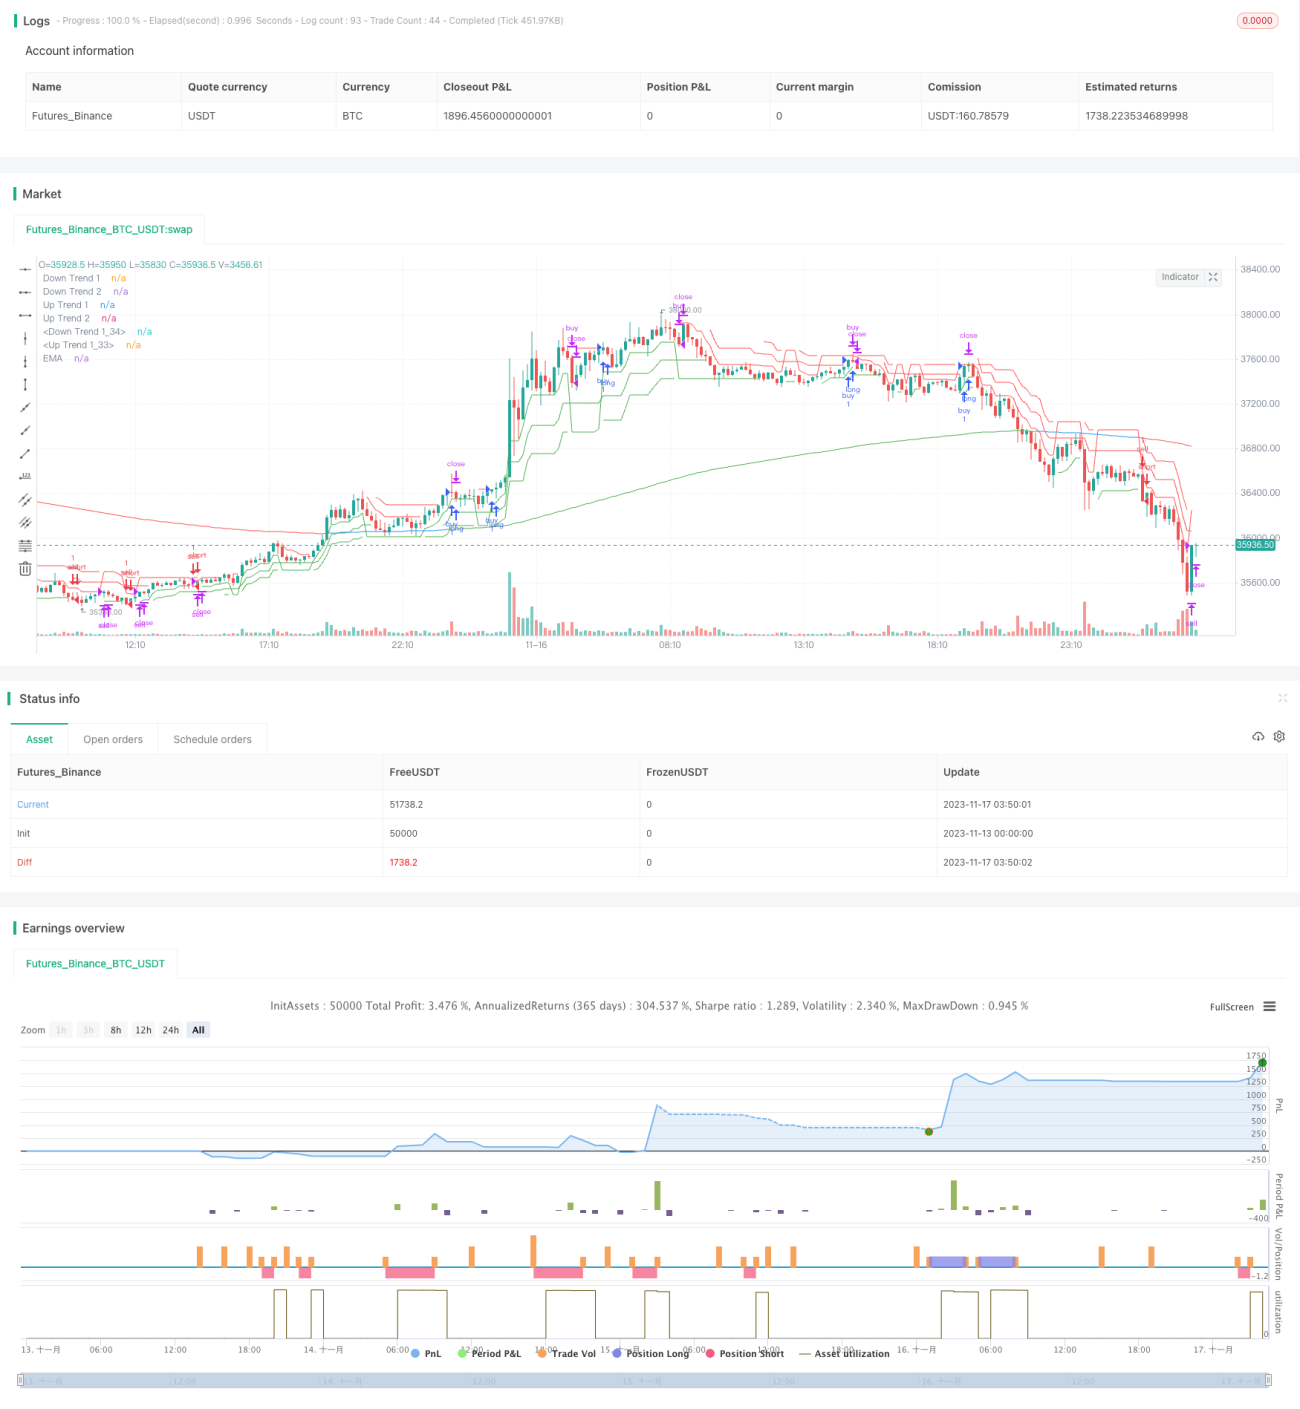
Esta estratégia permite uma operação de ruptura de seguimento de alta taxa de vitória através da construção de um canal de duplo triângulo, combinado com um indicador de tendência super, para determinar a direção da ruptura de preço. A estratégia, ao mesmo tempo, combina com a EMA para determinar a tendência geral do mercado e evitar negociações ineficazes em situações de turbulência.
Princípio da estratégia
-
Construção de um indicador de tendência super com três parâmetros diferentes para determinar a direção da tendência de preços a curto, médio e longo prazo.
-
O canal de duplo triângulo é usado para determinar se o preço quebrou o canal ascendente ou descendente, como um sinal de entrada e saída.
-
Combinando a EMA de 233 ciclos para determinar a direção da tendência geral, o preço precisa fazer mais para quebrar o canal ascendente no mercado de múltiplos EMAs, e o mercado de cabeças vazias para quebrar o canal descendente.
-
A combinação de três indicadores de tendência super é usada para determinar os sinais de parada e perda. Quando dois ou mais indicadores mudam de cor, a posição é parada ou perdida.
Vantagens estratégicas
-
O canal de duplo triângulo, combinado com o julgamento de múltiplos períodos de tempo, permite capturar com precisão as rupturas de tendência.
-
A seleção de múltiplos níveis evita que as transações sejam invalidadas e aumenta a taxa de vitória.
-
O sistema de tracking dinâmico de stop loss reduz o risco de retração.
-
Parâmetros simples e fácil de usar.
Riscos e otimização estratégica
-
No mercado de grandes ciclos de turbulência, pode ocorrer a abertura frequente de posições e, em seguida, a parada de perdas. Pode-se ajustar adequadamente o parâmetro do ciclo ATR para reduzir a frequência de abertura de posições.
-
Se o ciclo EMA for muito curto, não será possível determinar a tendência geral, e se for muito longo, o acompanhamento não será sensível. Recomenda-se testes para determinar o parâmetro EMA ideal.
-
Os níveis de stop loss não conseguem acompanhar de forma dinâmica a variação da amplitude de oscilação do mercado, e precisam de intervenção humana para ajustá-los.
Resumir
A estratégia de ruptura de duplo triângulo do rastreador de luz lunar permite a captura precisa de fortes rupturas por meio da combinação de indicadores de tendência super e canais de duplo triângulo. Ao mesmo tempo, o mecanismo de filtragem em vários níveis filtra os sinais ineficazes, com uma maior taxa de vitória. A configuração de parâmetros simples também facilita o uso.
- 1