Tendência seguindo estratégia do indicador Williams de EMA duplo

Visão geral
A estratégia combina o indicador EMA duplo com o indicador Williams para identificar a direção da tendência e a seguir quando a tendência é forte. A ideia básica é:
- Filtragem com combinação de duplas EMAs para eliminar as tendências mais fortes
- Indicador Williams confirma que está em zona de sobrevenda
- Combinado com o RSI, evite os altos e baixos
Princípios
A estratégia usa o EMA de curto prazo e o EMA de longo prazo em dois indicadores EMA. Quando o EMA de curto prazo gera um sinal de compra quando ele atravessa o EMA de longo prazo, e o EMA de curto prazo gera um sinal de venda quando ele atravessa o EMA de longo prazo, usando o EMA duplo para capturar a tendência de médio e longo prazo.
Além disso, a estratégia também combina com o indicador Williams para identificar reversões. O indicador Williams determina se o preço está em um estado de sobrecompra ou de sobrevenda, determinando os altos e baixos do ciclo. Quando o indicador Williams mostra um excesso de compra, gera um sinal de venda; Quando o indicador Williams mostra um excesso de venda, gera um sinal de compra.
A lógica do código é a seguinte:
Entrada múltipla: EMA curto a curto atravessa o EMA médio e o EMA longo, e o indicador Williams mostra áreas de sobrevenda e forma um ponto mínimo na área de sobrevenda, indicando uma oportunidade de reversão, no momento em que gera um sinal de compra.
Entradas em branco: EMA de curto prazo atravessa a EMA de médio prazo e a EMA de longo prazo, e o indicador Williams mostra áreas de sobrecompra e forma o ponto mais alto na área de sobrevenda, indicando uma oportunidade de reversão, no momento em que gera um sinal de venda.
Além disso, a estratégia também introduziu o indicador RSI para confirmar ainda mais os sinais de negociação e evitar a busca cega de quedas.
Vantagens
A principal vantagem desta estratégia é que ela usa o filtro de duplo EMA para eliminar uma grande quantidade de tendências inativas e apenas selecionar as tendências de médio e longo prazo mais fortes para acompanhar, filtrando assim o ruído e reduzindo as transações inativas.
Além disso, a introdução do indicador Williams também tem um efeito muito bom. Primeiro, é capaz de identificar oportunidades de reversão e, assim, fechar a posição a tempo; segundo, é capaz de confirmar ainda mais a eficácia dos sinais de tendência.
A combinação de dupla EMA e Williams permite que a estratégia obtenha bons lucros de acompanhamento em variedades de médio e longo prazo, além de ser capaz de identificar reversões e limitar perdas.
Riscos
O principal risco desta estratégia é a dificuldade de identificar o ponto de reversão da tendência. Apesar da introdução do indicador Williams e do indicador RSI para garantir a eficácia da reversão, a dificuldade de reversão ainda é grande e o risco de queda de queda não pode ser completamente evitado.
Além disso, o próprio portfólio de duplas EMAs também apresenta um certo atraso. Quando as tendências de curto prazo e as tendências de médio e longo prazo se desligam, isso também pode trazer alguma dificuldade para a estratégia de identificação.
Otimização
A estratégia pode ser melhorada em vários aspectos:
-
Testar mais combinações de ciclos EMA para encontrar melhores parâmetros
-
Aumentar o mecanismo de saída de adaptação, usando indicadores como o ATR, o índice de volatilidade e outros para avaliar a reversão da tendência
-
Adição de elementos de aprendizagem de máquina para a previsão de tendências e reversões com LSTM
-
Usando métodos como a teoria das ondas para aperfeiçoar ainda mais as regras de negociação inversa
-
Introdução de gerenciamento de posições adaptável, ajustando o tamanho das posições de acordo com as condições do mercado
Resumir
Esta estratégia combina bem a dupla EMA e o indicador de Williams para capturar tendências de médio e longo prazo, obtendo maiores ganhos nas grandes tendências. Ao mesmo tempo, a introdução do indicador de Williams também permite que a estratégia identifique reversões e pare os prejuízos em tempo hábil. O próximo passo é otimizar a estabilidade da estratégia, introduzindo mais indicadores e modelos.
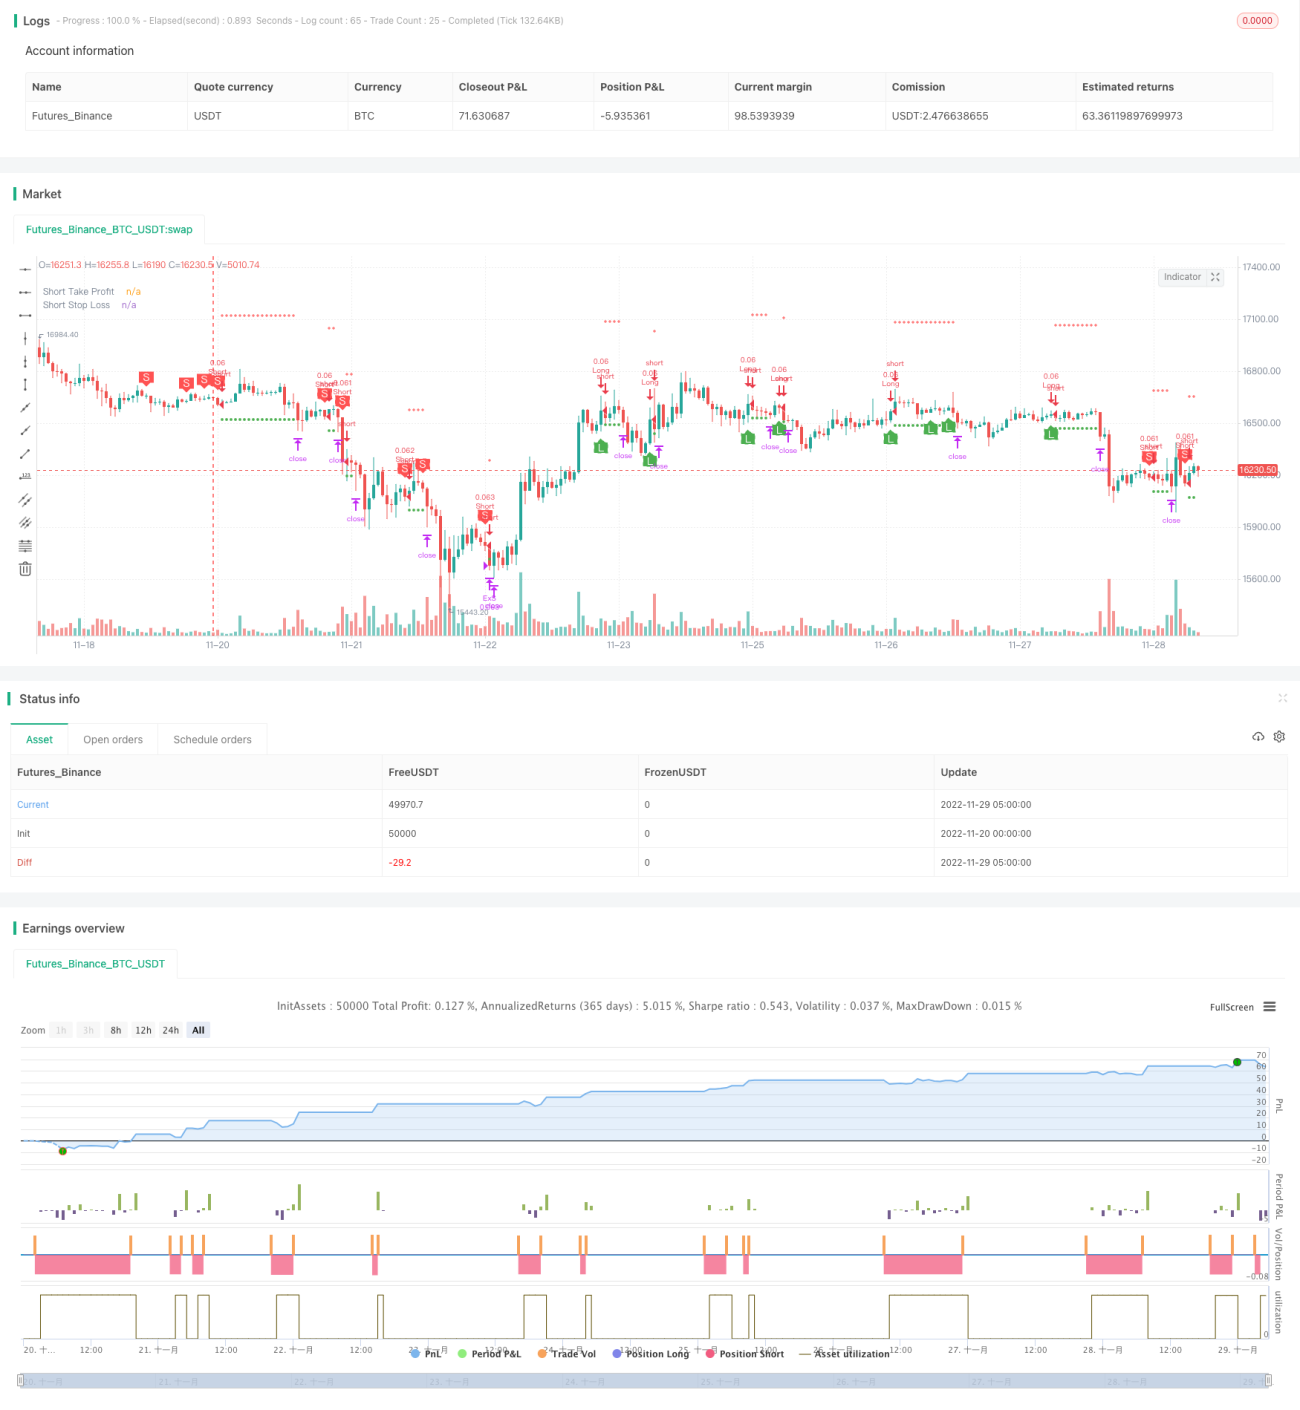
/*backtest
start: 2022-11-20 00:00:00
end: 2022-11-29 05:20:00
period: 1h
basePeriod: 15m
exchanges: [{"eid":"Futures_Binance","currency":"BTC_USDT"}]
*/

// This source code is subject to the terms of the Mozilla Public License 2.0 at https://mozilla.org/MPL/2.0/
// © B_L_A_C_K_S_C_O_R_P_I_O_N
// v 1.1
- 1