Estratégias de alta e baixa baseadas em canais de flutuação interna de preços

Visão geral
A estratégia utiliza o canal interno do preço para determinar a movimentação futura dos preços, e é uma estratégia de acompanhamento de tendências. Quando os preços formam uma certa quantidade de canal interno de flutuação dos preços, é considerado um sinal de reversão de tendência, para comprar ou vender.
Princípio da estratégia
A estratégia julga a formação de um canal interno com base na relação entre o preço máximo e o preço mínimo de duas linhas K anteriores e posteriores. Quando um certo número de linhas K satisfaz a condição de que o preço máximo é inferior ao preço máximo da linha K anterior e o preço mínimo é superior ao preço mínimo da linha K anterior, é julgado um canal interno de preços.
Ao mesmo tempo em que julga a formação de um canal interno de preço, a estratégia também julga a direção desse canal interno. Se for um canal interno de baixa, gera um sinal de compra; se for um canal interno de baixa, gera um sinal de venda. Portanto, a estratégia pertence a uma estratégia de negociação bidirecional.
Para filtrar os sinais falsos, a estratégia também introduziu o indicador de média móvel. Apenas quando o preço está acima ou abaixo da média móvel, um sinal de negociação real é produzido. Isso pode evitar, em parte, as transações erradas na liquidação do mercado.
Após a entrada, a estratégia também define um ponto de parada de perda de acordo com a escolha do usuário. Há três tipos de parada de perda escolhíveis: parada de ponto fixo, parada de ATR e parada de ponto máximo e mínimo anterior. A configuração de parada de parada é a paralisação da taxa de retorno do risco. Isso pode bloquear os lucros e controlar o risco até certo ponto.
Análise de vantagens
A maior vantagem desta estratégia é a sua capacidade de identificar os pontos de reversão de tendências. Quando os preços formam um certo número de canais internos, geralmente sinalizam a iminência de grandes quedas. Este julgamento é altamente compatível com a teoria da análise técnica tradicional.
Além disso, a estratégia em si é altamente configurável. Os usuários podem escolher livremente o número de canais internos, o ciclo da média móvel, os parâmetros de parada de perda, etc. Isso oferece uma grande flexibilidade para diferentes variedades e diferentes estilos de negociação.
Finalmente, a estratégia inclui filtros de média móvel e paradas de perda, o que reduz consideravelmente o risco de negociação. Isso permite que a estratégia seja aplicada a todos os tipos de negociação em diferentes ambientes de mercado.
Análise de Riscos
O maior risco desta estratégia é a maior probabilidade de erro no julgamento de tendências. Os canais internos não conseguem determinar completamente a reversão de preços, existindo uma certa probabilidade de erro. Se o número determinado for insuficiente, pode haver falsos sinais.
Além disso, a estratégia não se aplica em nenhum mercado de liquidação ou de turbulência. Quando os preços flutuam para cima e para baixo, mas não estabelecem uma tendência, a estratégia produzirá um sinal de erro contínuo. Isso é determinado pela mecânica da estratégia.
Finalmente, a configuração de stop loss é conservadora demais e pode impedir que a estratégia seja mantida por tempo suficiente para capturar o lucro da grande tendência. Isso requer que o usuário balance as configurações.
Direção de otimização
A estratégia ainda tem muito espaço para otimização. Algumas possíveis direções de otimização incluem:
-
Otimizar o número e a forma dos canais internos. Pode testar a eficácia das transações em diferentes números ou combinações de arranjos.
-
Otimizar os parâmetros de periodicidade das médias móveis para que sejam mais indicadores de tendências. O ciclo padrão atual pode não ser adequado para todas as variedades.
-
Adicionar outros filtros de indicadores. Por exemplo, introduzir a faixa de Brin, que só gera um sinal de negociação quando o preço quebra a faixa de Brin para cima ou para baixo.
-
Optimizar os parâmetros de stop loss para permitir que a estratégia mantenha uma posição por um período maior de tempo, capturando assim os lucros da supertrend.
Em geral, a estratégia existe pela sua precisão no julgamento de tendências. Com a garantia da precisão do julgamento, complementada com uma configuração apropriada de gerenciamento de risco, é possível negociar com algoritmos de melhor desempenho.
Resumir
A estratégia é, em geral, uma estratégia de negociação quantitativa baseada em canais internos de preços para determinar a tendência futura dos preços. Combina os dois métodos de determinação, acompanhamento de tendências e reversão de tendências, com certas vantagens. Mas também há espaço para otimização, onde o investidor pode ajustar de acordo com suas próprias necessidades para se adequar à variedade e ao ambiente de negociação específicos.
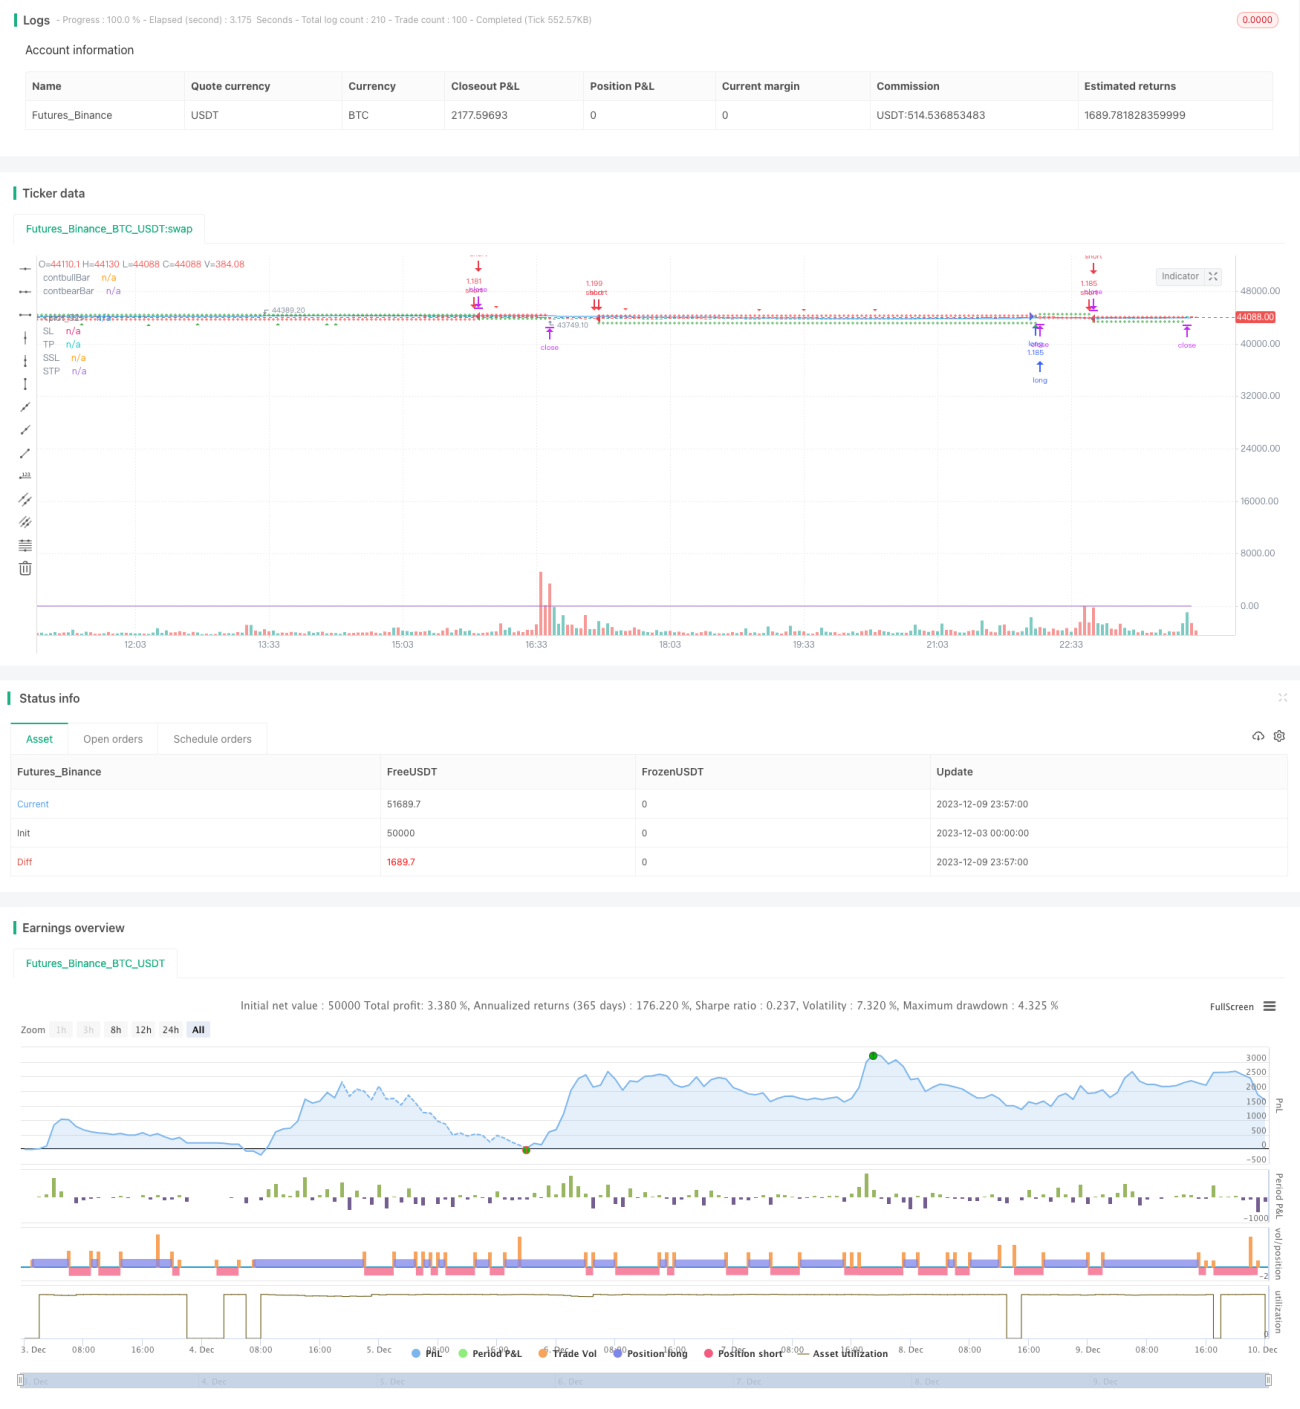
/*backtest
start: 2023-12-03 00:00:00
end: 2023-12-10 00:00:00
period: 3m
basePeriod: 1m
exchanges: [{"eid":"Futures_Binance","currency":"BTC_USDT"}]
*/

// This source code is subject to the terms of the Mozilla Public License 2.0 at https://mozilla.org/MPL/2.0/

// From "Day Trading Cryptocurrency
// Strategies, Tactics, Mindset, and Tools Required To Build Your - 1