Estratégias de timing de mercado baseadas na volatilidade histórica
Visão geral
Esta estratégia permite uma versão melhorada da estratégia de compra e posse, através da adição de um filtro baseado na volatilidade histórica. O papel do filtro é fechar as posições de compra e compra em períodos de alta volatilidade do mercado e reestabelecer as posições de compra e compra em períodos de baixa volatilidade, reduzindo assim o retorno máximo da estratégia.
Princípio da estratégia
- Calcular a flutuação histórica do SPY nos últimos 100 dias
- Se a flutuação atual for superior a 95 pontos da flutuação dos últimos 100 dias, filtre o dia de negociação e feche a posição de compra
- Se a volatilidade estiver abaixo do 95o, estabeleça uma posição de compra
Análise de vantagens
Em comparação com a estratégia simples de compra e posse sem filtro, a estratégia apresentou um aumento na taxa de retorno anual durante o período de 28 anos de retrospectiva (7,95% vs 9,92%), enquanto a máxima retirada caiu significativamente (5,0.79% vs 31,57%). Isso mostra que a adição de filtros de volatilidade de mercado pode aumentar a taxa de retorno da estratégia e reduzir o risco.
Análise de Riscos
O principal risco desta estratégia reside no método de cálculo da taxa de flutuação e na precisão da configuração dos parâmetros do filtro. Se a taxa de flutuação não for calculada com precisão, o filtro será inoperante; Se a configuração dos parâmetros do filtro for muito conservadora ou muito radical, o resultado da estratégia será prejudicado. Além disso, o desempenho passado não é indicativo de resultados futuros.
Direção de otimização
Pode-se considerar a inclusão de outros indicadores de filtro como sinais de confirmação, como a média móvel de longo prazo, o indicador ADX do índice de disco maciço, etc. A otimização de ajustes de parâmetros também é fundamental, como o teste de diferentes configurações de parâmetros, como período de lookback, filtering threshold, etc.
Resumir
Esta estratégia, através de um simples filtro baseado na volatilidade histórica, aumenta consideravelmente a rentabilidade da estratégia de compra e posse SPY, ao mesmo tempo em que reduz significativamente a retirada máxima. Isso prova a importância da identificação do estado do mercado e da configuração de ativos. Podemos aperfeiçoar ainda mais a estratégia continuando a otimizar o modelo de volatilidade e adicionar sinais de confirmação.
/*backtest
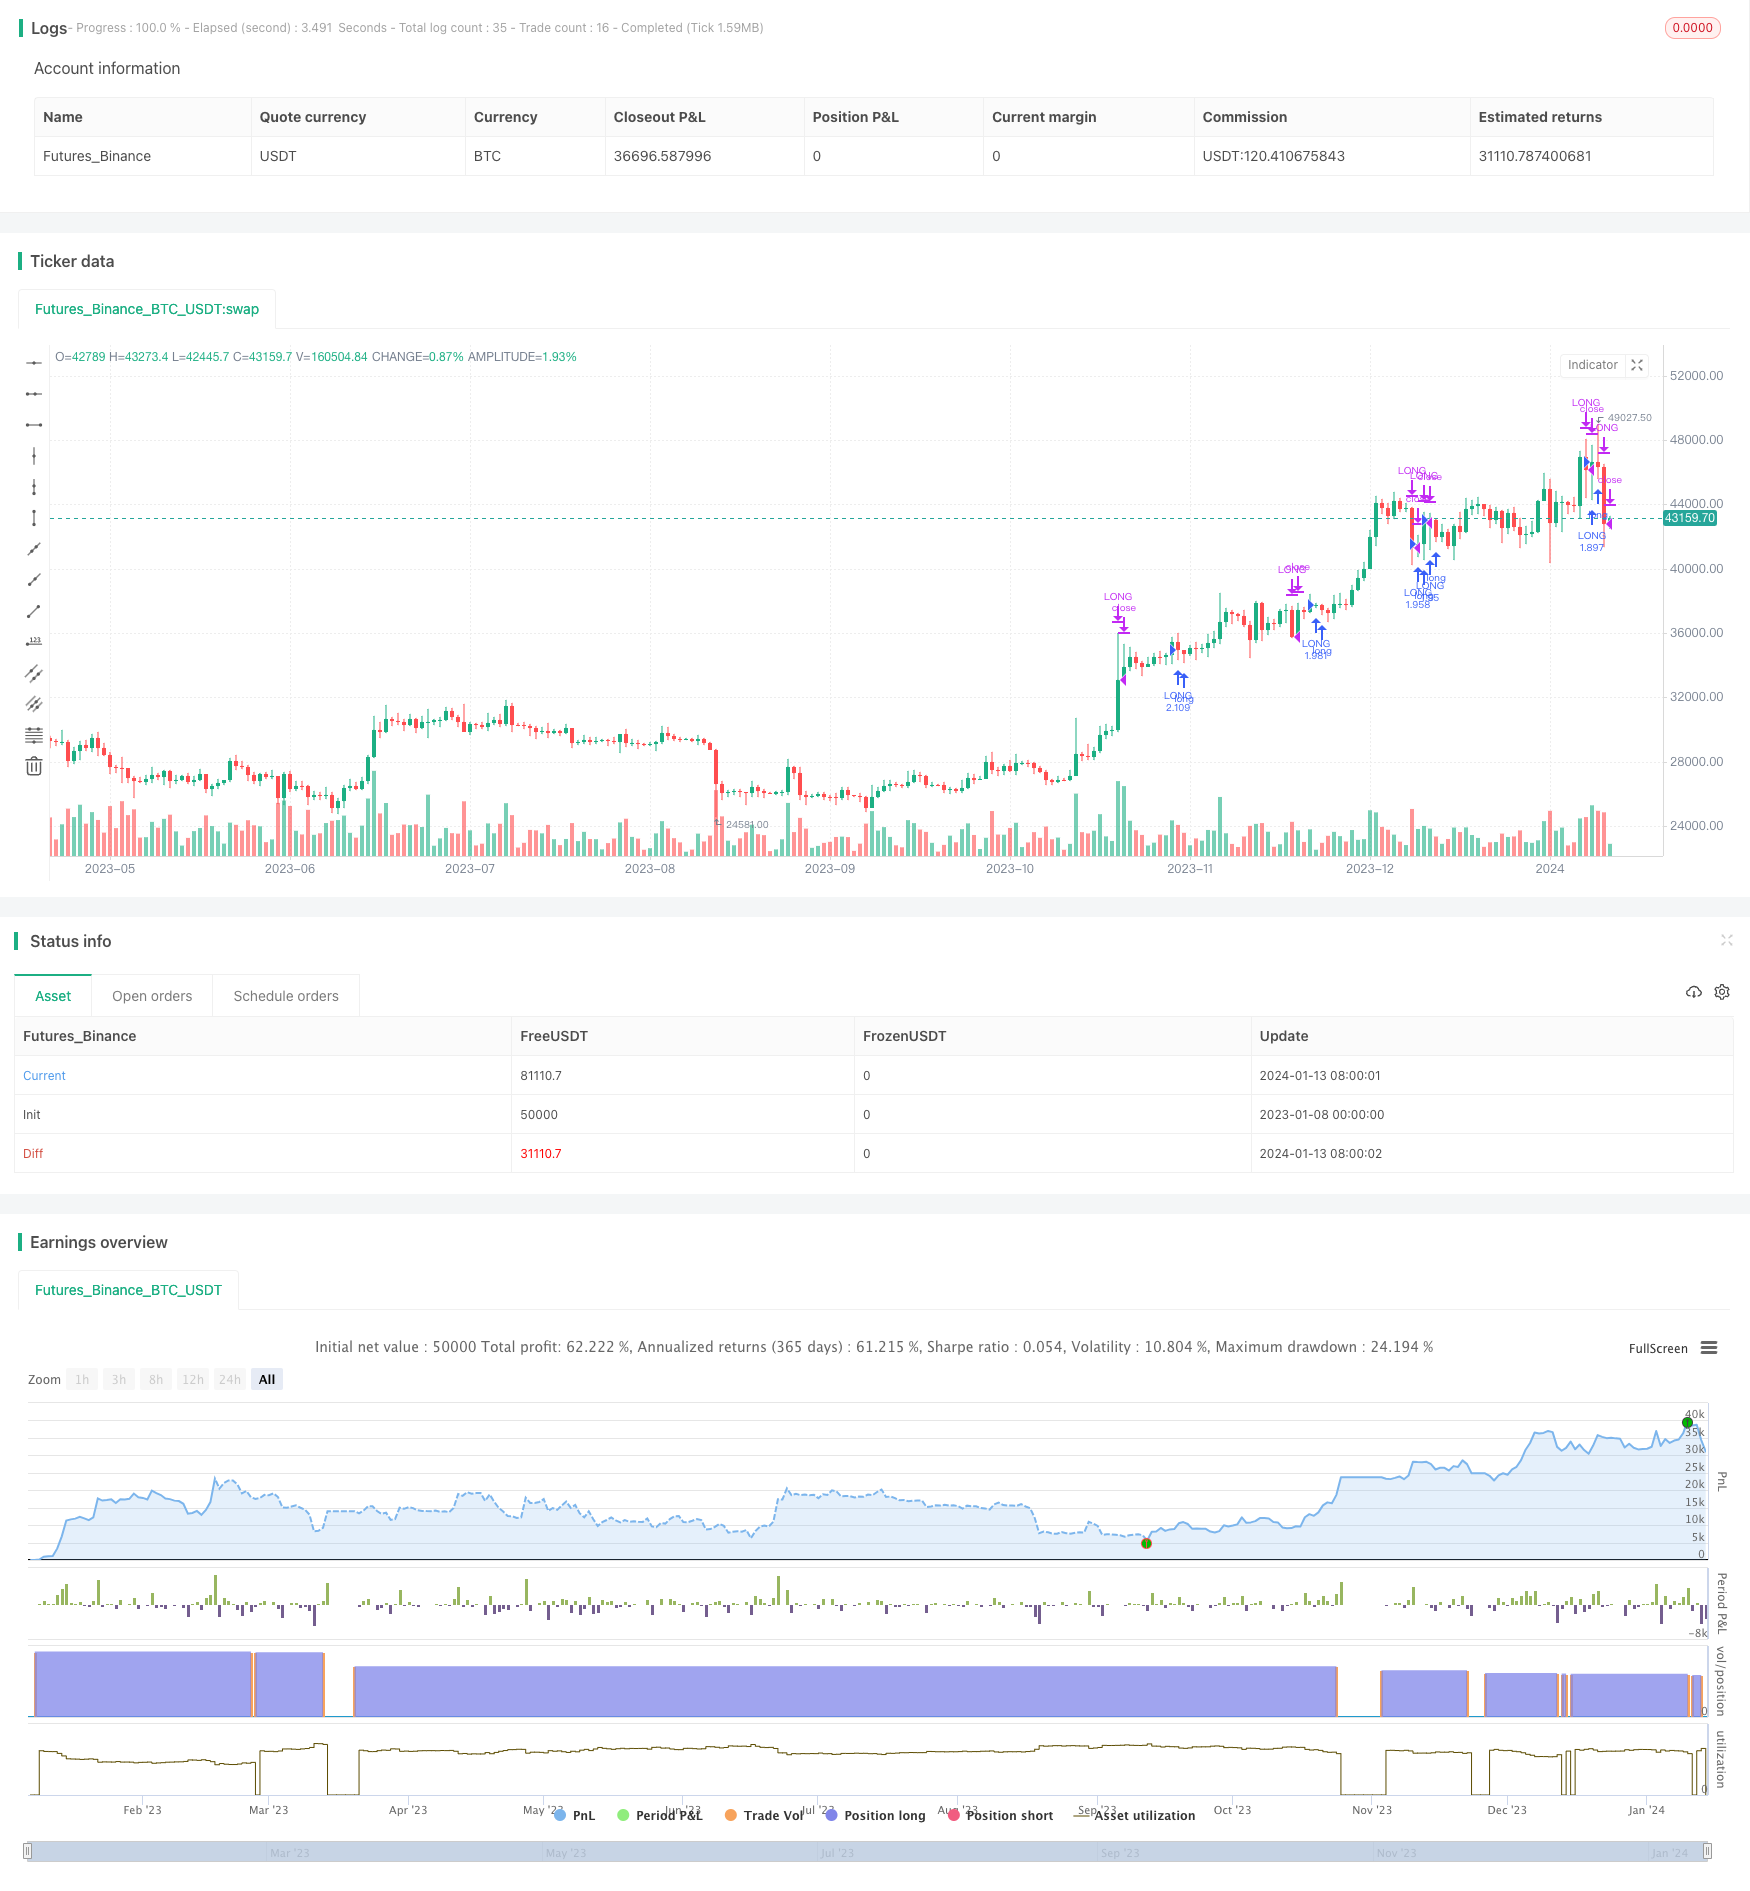
start: 2023-01-08 00:00:00
end: 2024-01-14 00:00:00
period: 1d
basePeriod: 1h
exchanges: [{"eid":"Futures_Binance","currency":"BTC_USDT"}]
*/
// This source code is subject to the terms of the Mozilla Public License 2.0 at https://mozilla.org/MPL/2.0/
//
// @author Sunil Halai
//
// This script has been created to demonstrate the effectiveness of using market regime filters in your trading strategy, and how they can improve your returns and lower your drawdowns
//
// This strategy adds a simple filter (The historical volatility filter, which can be found on my trading profile) to a traditional buy and hold strategy of the index SPY. There are other filters
// that could also be added included a long term moving average / percentile rank filter / ADX filter etc, to improve the returns further.
//
// The filter added closes our long position during periods of volatility that exceed the 95th percentile (or in the top 5% of volatile days)
//
// Have included the back test results since 1993 which is 28 years of data at the time of writing, Comparing buy and hold of the SPY (S&P 500), to improved by and hold offered here.
//
// Traditional buy and hold:
//
// Return per year: 7.95 % (ex Dividends)
// Total return : 851.1 %
// Max drawdown: 50.79 %
//
// 'Modified' buy and hold (this script):
//
// Return per year: 9.92 % (ex Dividends)
// Total return: 1412.16 %
// Max drawdown: 31.57 %
//
// Feel free to use some of the market filters in my trading profile to improve and refine your strategies further, or make a copy and play around with the code yourself. This is just
// a simple example for demo purposes.
//
//@version=4
strategy(title = "Simple way to beat the market [STRATEGY]", shorttitle = "Beat The Market [STRATEGY]", overlay=true, initial_capital=100000, default_qty_type=strategy.percent_of_equity, currency="USD", default_qty_value=100)
upperExtreme = input(title = "Upper percentile filter (Do not trade above this number)", type = input.integer, defval = 95)
lookbackPeriod = input(title = "Lookback period", type = input.integer, defval = 100)
annual = 365
per = timeframe.isintraday or timeframe.isdaily and timeframe.multiplier == 1 ? 1 : 7
hv = lookbackPeriod * stdev(log(close / close[1]), 10) * sqrt(annual / per)
filtered = hv >= percentile_nearest_rank(hv, 100, upperExtreme)
if(not(filtered))
strategy.entry("LONG", strategy.long)
else
strategy.close("LONG")