Estratégia de ruptura de choque de tendência unilateral
Visão geral
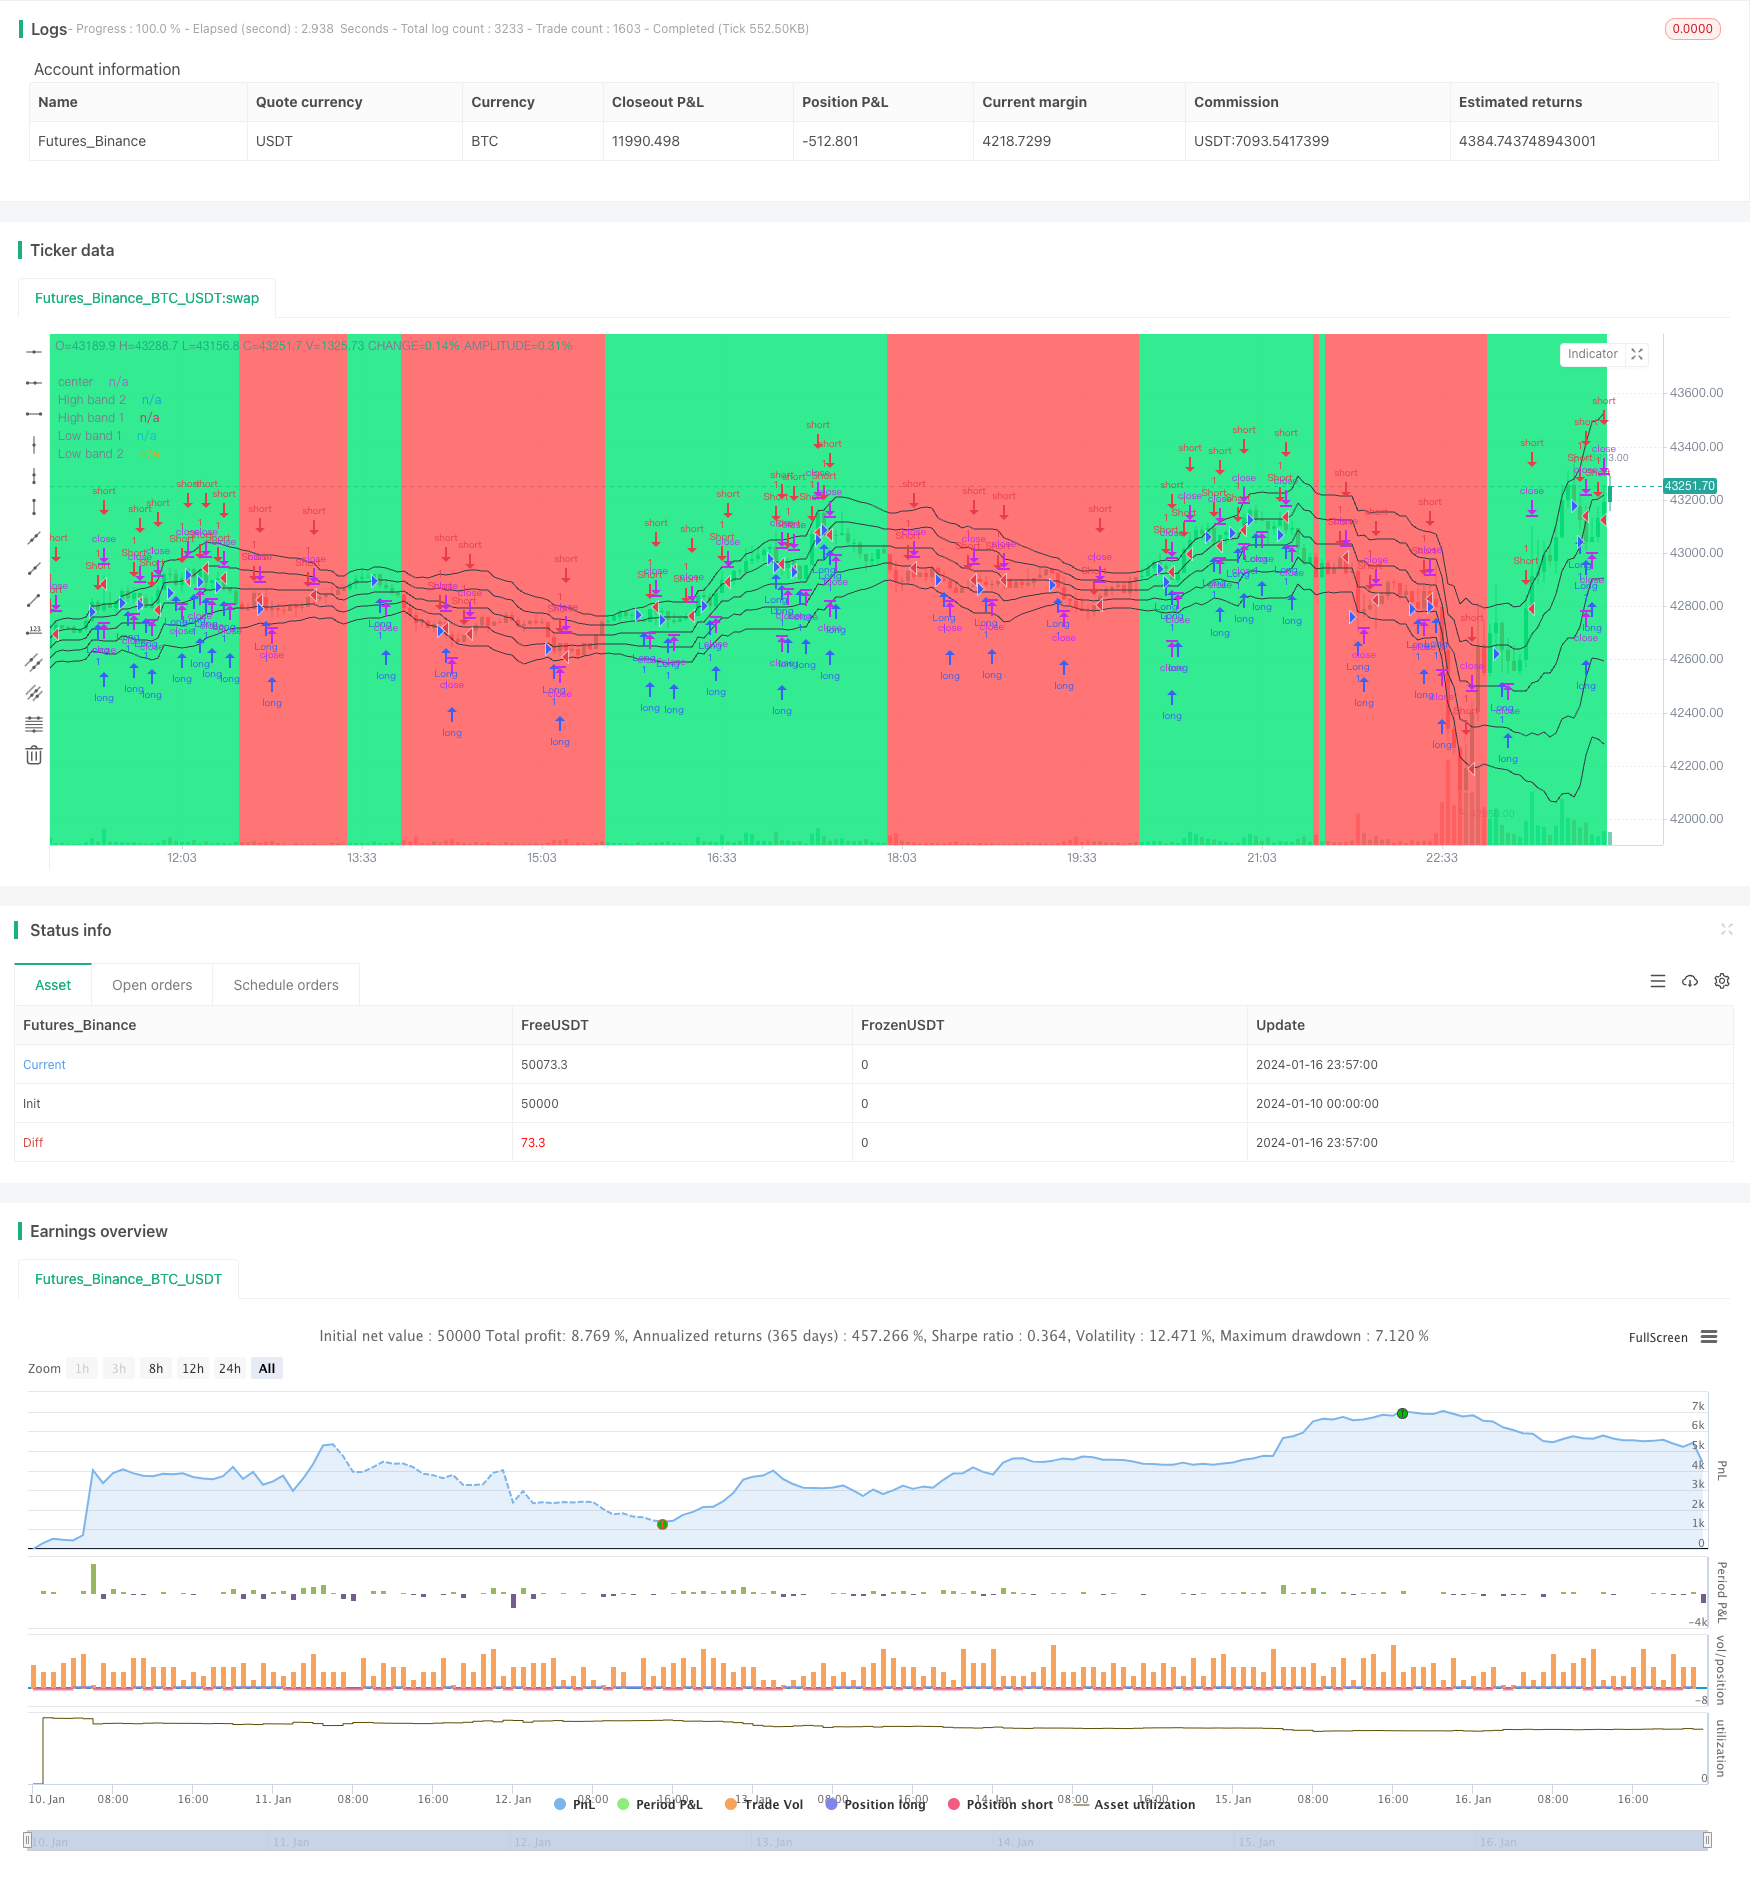
A estratégia de ruptura de choque de tendência de lado único (Single Side Trend Shock Breakout Strategy) é uma estratégia de ruptura que usa o canal de preço e o julgamento de tendência. Ela visa identificar a direção da tendência, entrar em uma entrada de ruptura em uma zona de choque e sair depois de atingir o objetivo de lucro estabelecido.
Princípio da estratégia
A estratégia opera calculando a trajetória ascendente e descendente do canal de preços para determinar se o preço quebrou o canal. Concretamente, a estratégia primeiro calcula os preços mais altos e mais baixos dos últimos N ciclos e calcula a linha média do preço. Em seguida, calcula a distância média absoluta entre o preço e a linha média, obtendo a trajetória ascendente e descendente.
Ao determinar a tendência, a estratégia verifica se as últimas linhas K estão todas fechadas acima do canal (sinais de múltiplas cabeças) ou abaixo do canal (sinais de cabeças vazias). Ao determinar a tendência, a estratégia espera que os preços se movam, formando um sinal de ruptura perto do canal acima ou abaixo do canal, entrando no campo por meio de entrada invertida.
Além disso, a estratégia também julga a ruptura de uma entidade da linha K como um sinal de entrada complementar. A estratégia define um objetivo de lucro após a entrada e interrompe ativamente quando o preço atinge o objetivo.
Análise de vantagens
A estratégia tem as seguintes vantagens:
- Usar o canal de preços para determinar a direção da tendência reduz a probabilidade de falsas rupturas
- Entradas reversíveis podem ser lucrativas quando a tendência é fraca
- A ruptura da entidade como sinal complementar para aumentar a precisão de entrada
- Defina um alvo de parada para ativar a parada.
Análise de Riscos
A estratégia também apresenta alguns riscos:
- Parâmetros de canal de preço mal definidos, podendo resultar em um alcance de canal muito grande ou muito pequeno
- Operação de reversão de forte tendência pode causar maiores perdas
- A penetração de uma entidade é propensa a falsos sinais.
- A configuração errada do travão pode prejudicar os lucros.
Para reduzir o risco, pode-se ajustar os parâmetros para reduzir o alcance do canal, evitar a construção de posições invertidas em fortes tendências, otimizar a lógica de parada, etc.
Direção de otimização
A estratégia também pode ser melhorada nas seguintes direções:
- Aumentar os indicadores de avaliação de tendências para garantir a sua precisão
- Parâmetros para otimizar a ruptura de entidades, reduzindo a taxa de falso sinal de cabeça
- A partir de agora, o jogo será dividido em quatro partes:
- Ajuste dinâmico da posição do parafuso
Resumir
A estratégia unilateral de ruptura de tendência de tendência através de canais de preço e tendência de julgamento, o método de construção de posição inversa na zona de turbulência de lucro. Tem a vantagem de julgar a tendência, bloquear a iniciativa, mas também existe um certo risco. Através de confirmação de vários indicadores, a otimização de parâmetros e outros meios podem reduzir o risco para aumentar a margem de lucro.
/*backtest
start: 2024-01-10 00:00:00
end: 2024-01-17 00:00:00
period: 3m
basePeriod: 1m
exchanges: [{"eid":"Futures_Binance","currency":"BTC_USDT"}]
*/


//@version=2
strategy("Noro's Bands Scalper Strategy v1.5", shorttitle = "Scalper str 1.5", overlay=true, default_qty_type = strategy.percent_of_equity, default_qty_value=100.0, pyramiding=0)

//Settings
needlong = input(true, defval = true, title = "Long")
needshort = input(true, defval = true, title = "Short")
takepercent = input(0, defval = 0, minval = 0, maxval = 1000, title = "take, %")
needbe = input(true, defval = true, title = "Bands Entry")
needct = input(false, defval = false, title = "Counter-trend entry")
bodylen = input(10, defval = 10, minval = 0, maxval = 50, title = "Body length")
trb = input(1, defval = 1, minval = 1, maxval = 5, title = "Trend bars")
len = input(20, defval = 20, minval = 2, maxval = 200, title = "Period")
needbb = input(true, defval = true, title = "Show Bands")
needbg = input(true, defval = true, title = "Show Background")
src = close

//PriceChannel 1
lasthigh = highest(src, len)
lastlow = lowest(src, len)
center = (lasthigh + lastlow) / 2

//Distance
dist = abs(src - center)
distsma = sma(dist, len)
hd = center + distsma
ld = center - distsma
hd2 = center + distsma * 2
ld2 = center - distsma * 2

//Trend
chd = close > hd
cld = close < ld
uptrend = trb == 1 and chd ? 1 : trb == 2 and chd and chd[1] ? 1 : trb == 3 and chd and chd[1] and chd[2] ? 1 : trb == 4 and chd and chd[1] and chd[2] and chd[3] ? 1 : trb == 5 and chd and chd[1] and chd[2] and chd[3] and chd[4] ? 1 : 0
dntrend = trb == 1 and cld ? 1 : trb == 2 and cld and cld[1] ? 1 : trb == 3 and cld and cld[1] and cld[2] ? 1 : trb == 4 and cld and cld[1] and cld[2] and cld[3] ? 1 : trb == 5 and cld and cld[1] and cld[2] and cld[3] and cld[4] ? 1 : 0
trend = dntrend == 1 and high < center ? -1 : uptrend == 1 and low > center ? 1 : trend[1]

//trend = close < ld and high < center ? -1 : close > hd and low > center ? 1 : trend[1]

//Lines
colo = needbb == false ? na : black
plot(hd2, color = colo, linewidth = 1, transp = 0, title = "High band 2")
plot(hd, color = colo, linewidth = 1, transp = 0, title = "High band 1")
plot(center, color = colo, linewidth = 1, transp = 0, title = "center")
plot(ld, color = colo, linewidth = 1, transp = 0, title = "Low band 1")
plot(ld2, color = colo, linewidth = 1, transp = 0, title = "Low band 2")

//Background
col = needbg == false ? na : trend == 1 ? lime : red
bgcolor(col, transp = 80)

//Body
body = abs(close - open)
smabody = ema(body, 30) / 10 * bodylen

//Signals
bar = close > open ? 1 : close < open ? -1 : 0
up7 = trend == 1 and ((bar == -1 and bar[1] == -1) or (body > smabody and bar == -1)) ? 1 : 0
dn7 = trend == 1 and ((bar == 1 and bar[1] == 1) or (close > hd and needbe == true)) and close > strategy.position_avg_price * (100 + takepercent) / 100 ? 1 : 0
up8 = trend == -1 and ((bar == -1 and bar[1] == -1) or (close < ld2 and needbe == true)) and close < strategy.position_avg_price * (100 - takepercent) / 100 ? 1 : 0
dn8 = trend == -1 and ((bar == 1 and bar[1] == 1) or (body > smabody and bar == 1)) ? 1 : 0

if up7 == 1 or up8 == 1
    strategy.entry("Long", strategy.long, needlong == false ? 0 : trend == -1 and needct == false ? 0 : na)

if dn7 == 1 or dn8 == 1
    strategy.entry("Short", strategy.short, needshort == false ? 0 : trend == 1 and needct == false ? 0 : na)