Estratégia de acompanhamento de tendência de cruzamento de média móvel
Visão geral
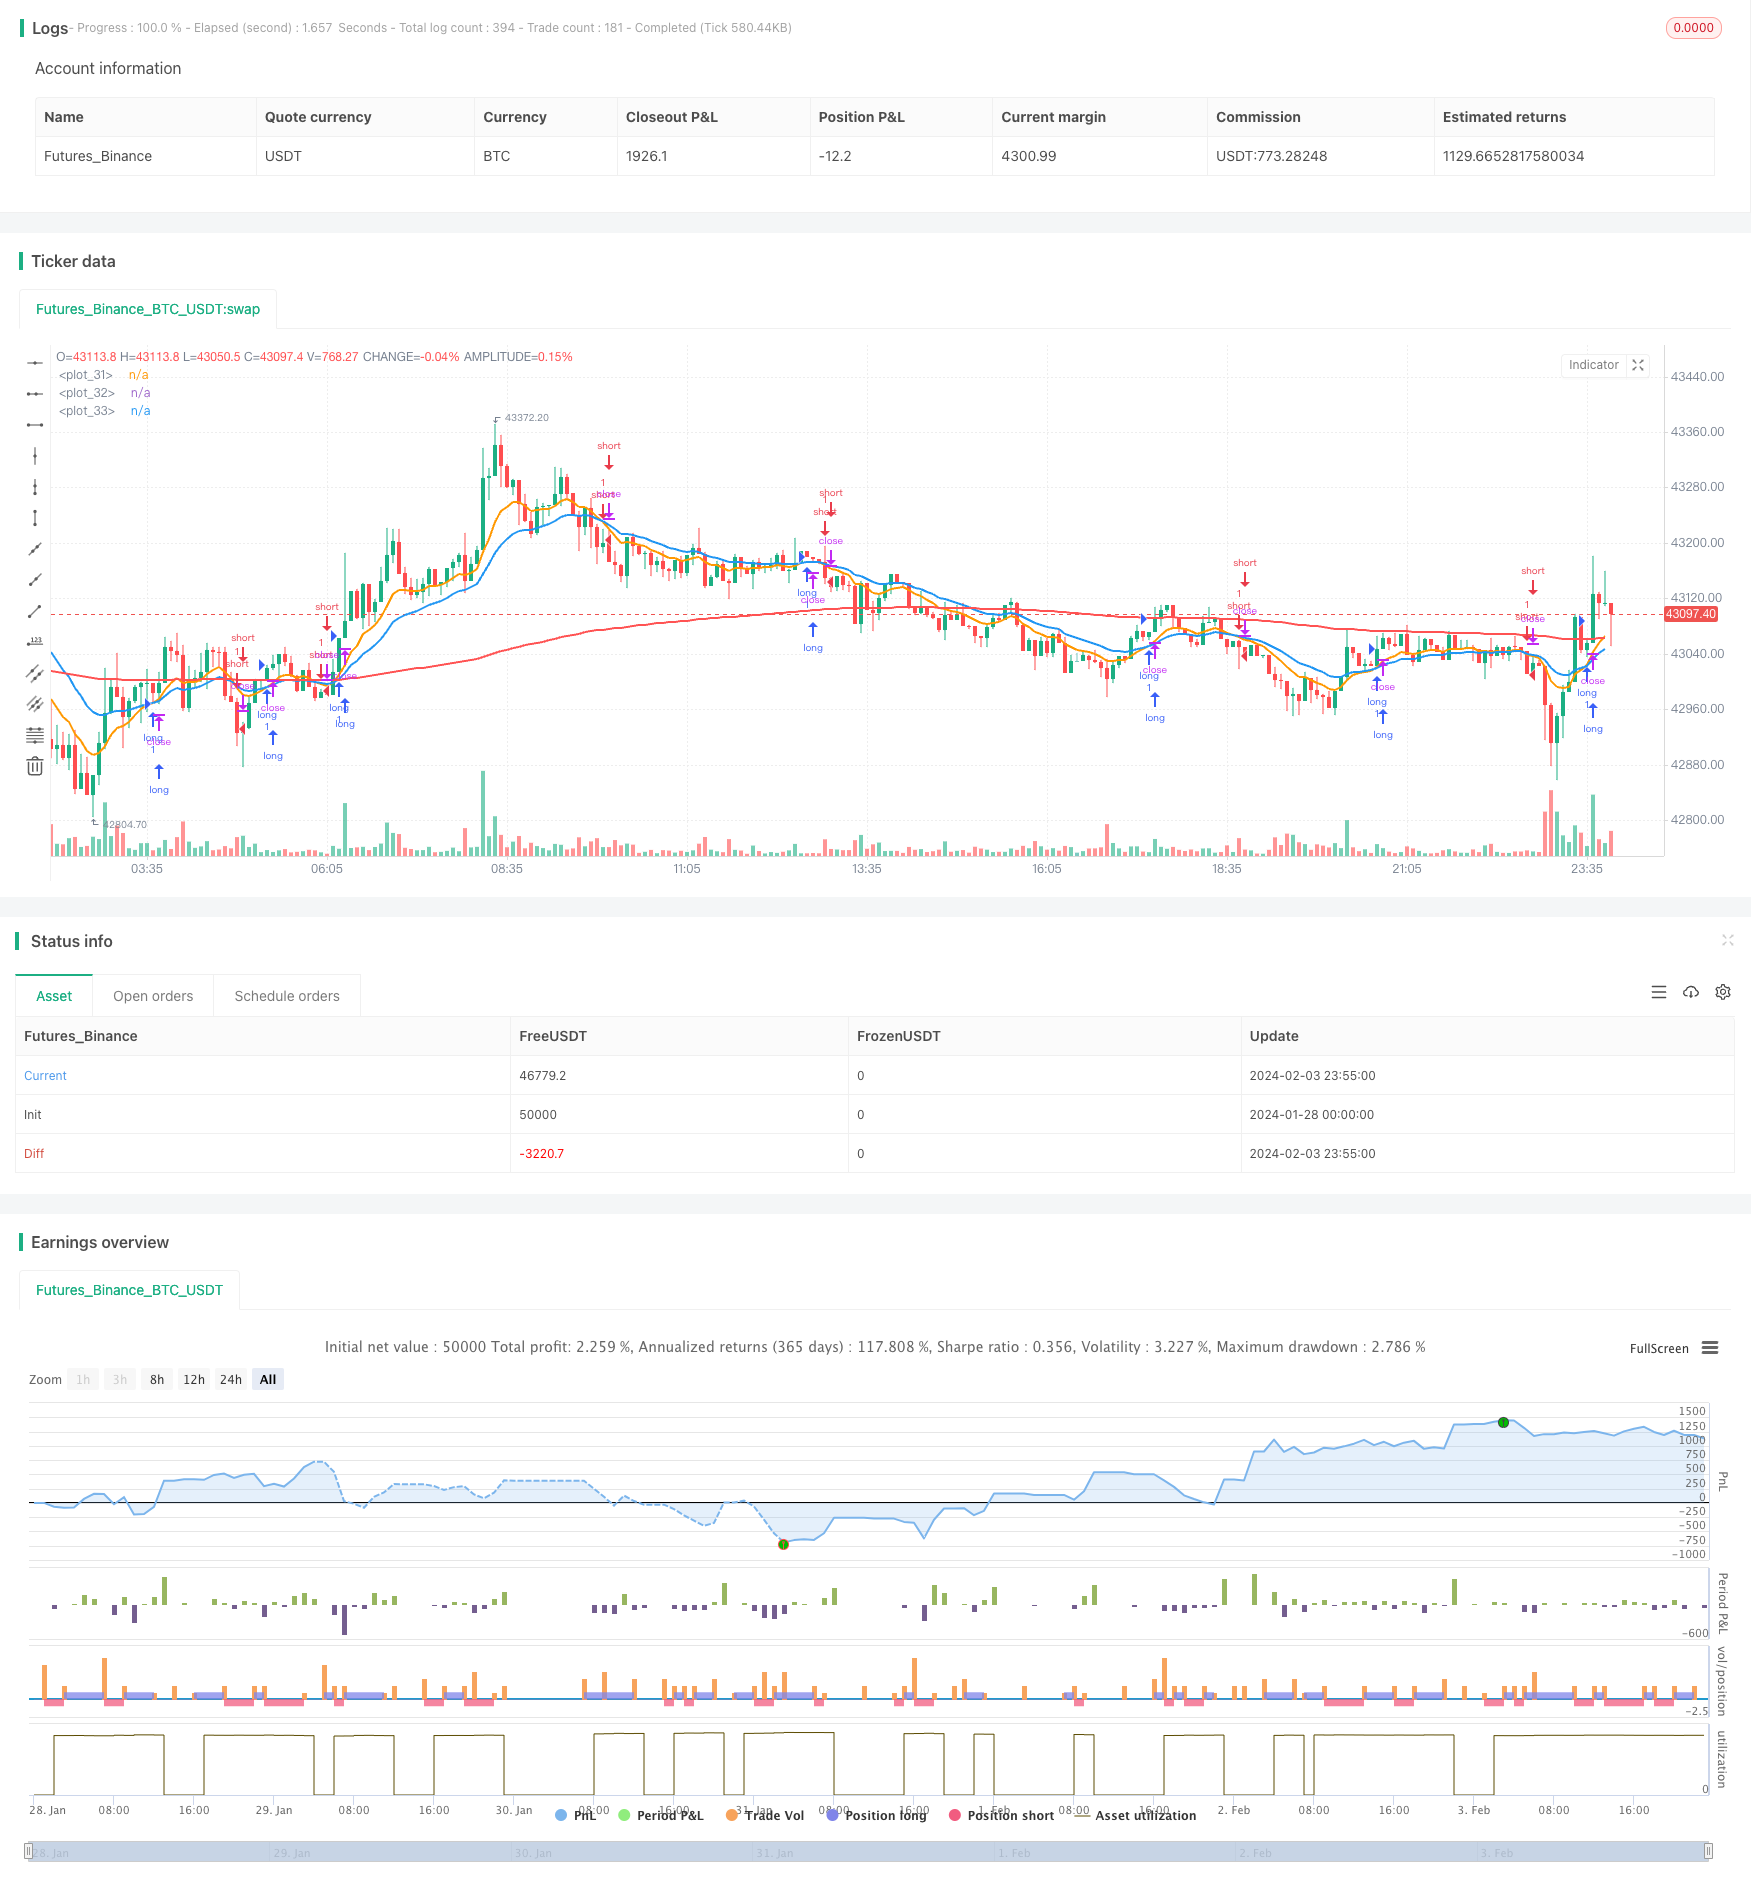
A estratégia de rastreamento de tendências de cruzamento de médias móveis é uma estratégia de negociação quantitativa para rastrear tendências de mercado. A estratégia gera sinais de negociação para capturar os pontos de inflexão de tendências de mercado, calculando médias móveis rápidas e médias móveis lentas e gerando sinais de negociação quando elas se cruzam.
Princípio da estratégia
O princípio central da estratégia é o uso de diferentes parâmetros de EMA para julgar a tendência do mercado. A estratégia define um EMA rápido e um EMA lento. Quando o EMA rápido atravessa o EMA lento de baixo para cima, o mercado vira-se bull; Quando o EMA rápido atravessa o EMA lento de cima para baixo, o mercado vira-se bear.
A estratégia abrirá uma carta em cima e uma carta em baixo. A estratégia manterá a posição até que o stop loss seja acionado ou um sinal de reversão de cruzamento ocorra novamente.
Análise de vantagens
A estratégia tem as seguintes vantagens:
- A lógica da estratégia é simples, clara, fácil de entender e apropriada para aprendizagem de iniciantes;
- O EMA pode ser usado para filtrar o ruído do mercado e identificar as tendências.
- A flexibilidade de ajustar os parâmetros de acordo com os diferentes períodos do mercado;
- A estratégia pode ser estendida para versões de vários períodos de tempo, aumentando a estabilidade.
Análise de Riscos
A estratégia também apresenta alguns riscos:
- Em situações de turbulência, podem ocorrer várias paradas de perdas que afetam os lucros;
- Não é possível identificar com eficácia o tipo de tendência (bull e bear) que pode levar a grandes perdas;
- A configuração incorreta dos parâmetros da EMA pode levar a uma frequência de negociação excessiva ou a um atraso no reconhecimento.
Para reduzir o risco, considere combinar outros indicadores para determinar o tipo de tendência, ou configure um Stop Loss Ratio mais flexível.
Direção de otimização
A estratégia também pode ser melhorada nos seguintes aspectos:
- Aumentar o discernimento sobre o tipo de tendência e evitar posições invertidas;
- Aumentar o julgamento de múltiplos ciclos de tempo e melhorar a qualidade do sinal;
- Ajuste dinâmico da proporção de stop loss para otimizar o ponto de saída;
- Combinado com outros indicadores de filtragem de sinais, reduz o erro de negociação.
Resumir
A estratégia de rastreamento de tendências de cruzamento de equilíbrio móvel é uma estratégia de negociação de tendências simples e prática. A ideia central da estratégia é clara e fácil de praticar, mas há também um certo espaço para otimização.
/*backtest
start: 2024-01-28 00:00:00
end: 2024-02-04 00:00:00
period: 5m
basePeriod: 1m
exchanges: [{"eid":"Futures_Binance","currency":"BTC_USDT"}]
*/

//@version=5
strategy('Zhukov trade', overlay=true, calc_on_every_tick=true, currency=currency.USD)

// INPUT:

// Options to enter fast and slow Exponential Moving Average (EMA) values
emaFast = input.int(title='Fast EMA', defval=10, minval=1, maxval=9999)
emaSlow = input.int(title='Slow EMA', defval=20, minval=1, maxval=9999)

// Option to select trade directions
tradeDirection = input.string(title='Trade Direction', options=['Long', 'Short', 'Both'], defval='Both')

// Options that configure the backtest date range
startDate = input(title='Start Date', defval=timestamp('01 Jan 2023 00:00'))
endDate = input(title='End Date', defval=timestamp('31 Dec 2030 23:59'))

// Set take profit and stop loss percentages
take_profit_percent = input(1.0, title ="Take Profit Percent") / 100.0
stop_loss_percent = input(1.0, title ="Stop Loss Percent") / 100.0

// CALCULATIONS:

// Use the built-in function to calculate two EMA lines
fastEMA = ta.ema(close, emaFast)
slowEMA = ta.ema(close, emaSlow)
emapos = ta.ema(close, 200)

// PLOT:

// Draw the EMA lines on the chart
plot(series=fastEMA, color=color.new(color.orange, 0), linewidth=2)
plot(series=slowEMA, color=color.new(color.blue, 0), linewidth=2)
plot(series=emapos, color=color.new(color.red, 0), linewidth=2)

// CONDITIONS:

// Check if the close time of the current bar falls inside the date range
inDateRange = true

// Translate input into trading conditions
longOK = tradeDirection == 'Long' or tradeDirection == 'Both'
shortOK = tradeDirection == 'Short' or tradeDirection == 'Both'

// Decide if we should go long or short using the built-in functions
longCondition = ta.crossover(fastEMA, slowEMA) and inDateRange
shortCondition = ta.crossunder(fastEMA, slowEMA) and inDateRange

// ORDERS:

// Submit entry (or reverse) orders
if longCondition and longOK
    strategy.entry(id='long', direction=strategy.long)

if shortCondition and shortOK
    strategy.entry(id='short', direction=strategy.short)

// Exit orders
if strategy.position_size > 0 and longOK
    strategy.exit(id='exit long', from_entry='long', limit=strategy.position_avg_price * (1 + take_profit_percent), stop=strategy.position_avg_price * (1 - stop_loss_percent))

if strategy.position_size < 0 and shortOK
    strategy.exit(id='exit short', from_entry='short', limit=strategy.position_avg_price * (1 - take_profit_percent), stop=strategy.position_avg_price * (1 + stop_loss_percent))