Стратегия прорыва двойного треугольника Moonlight Tracker

Обзор
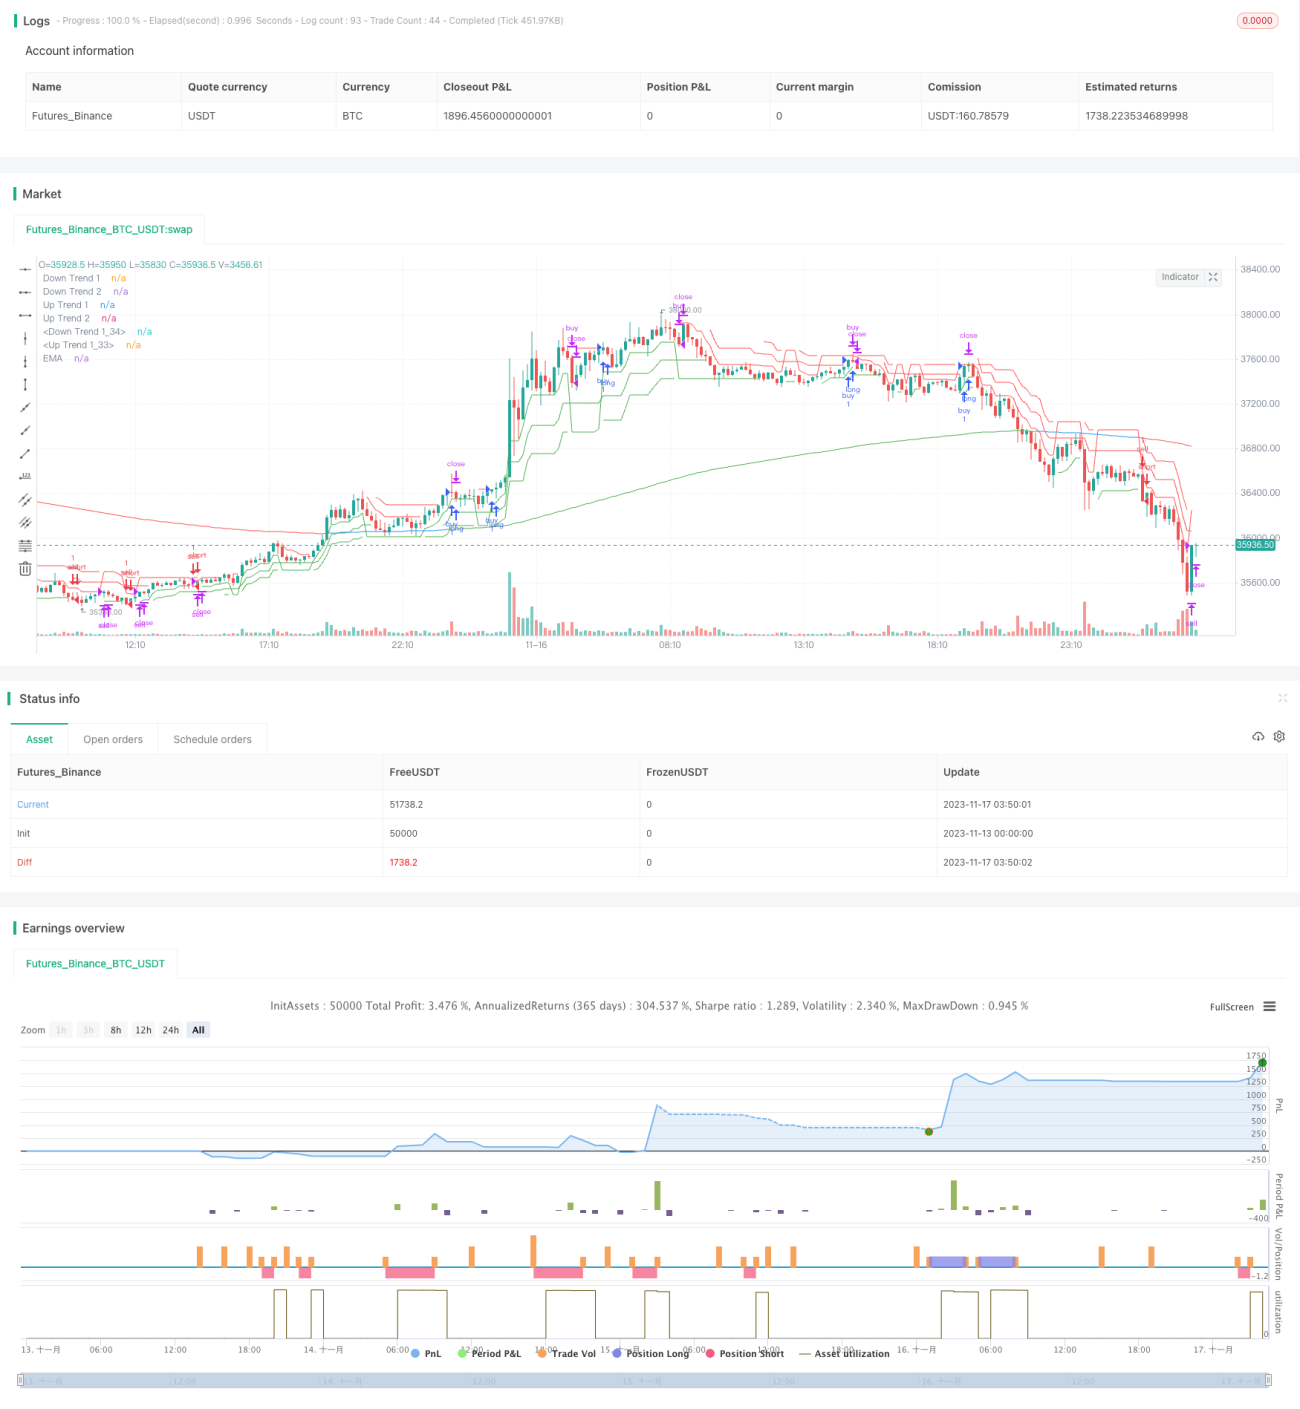
Эта стратегия позволяет достичь высокой вероятности выигрыша в операциях по отслеживанию прорыва путем построения двойного треугольного канала в сочетании с индикатором супертенденции, который определяет направление прорыва цены. Эта стратегия одновременно сочетает в себе определение общей тенденции рынка в сочетании с EMA и предотвращает неэффективную торговлю в условиях шока.
Стратегический принцип
-
Построение супер трендового индикатора с тремя различными параметрами для определения краткосрочного, среднесрочного и долгосрочного направления цены.
-
Двойной треугольный канал используется для определения того, прорвет ли цена верхний или нижний канал, как сигнал ListEntry и Exit.
-
В сочетании с 233-ми циклами EMA, чтобы определить направление общей тенденции, цены должны сделать больше, чтобы преодолеть верхний канал в многоголовом рынке EMA, а пустой рынок должен преодолеть нижний канал.
-
Определение стоп-сигналов и стоп-убытков в сочетании с тремя индикаторами супертенденции. Стоп-позиции или стоп-убытки при изменении цвета более чем двух индикаторов.
Стратегические преимущества
-
Двойной треугольный канал в сочетании с многократным временным циклом позволяет точно улавливать тенденционные прорывы.
-
Многоуровневые условия отбора позволяют избежать недействительных сделок и повысить шансы на победу.
-
Динамический отслеживающий стоп-стоп снижает риск отмены.
-
Простые параметры и простота использования.
Стратегические риски и оптимизация
-
В условиях большого циклического колебания рынка может возникать ситуация, когда часто открываются позиции, а затем остановляются. Можно соответствующим образом скорректировать циклические параметры ATR, чтобы снизить частоту открытия позиций.
-
Слишком короткий цикл EMA не позволяет определить общую тенденцию, слишком длинный - нечувствительный к отслеживанию. Рекомендуется тестирование для определения оптимальных параметров EMA.
-
Уровень стоп-лосса не может динамически отслеживать изменение волатильности рынка и требует корректировки с помощью человеческого вмешательства. В дальнейшем можно рассмотреть возможность динамической корректировки стоп-лосса в сочетании с ATR.
Подвести итог
Стратегия двутреугольного прорыва Moonlight Tracker обеспечивает точный захват сильных прорывов путем сочетания сверхтенденционного индикатора и двутреугольного канала. При этом многоуровневый фильтрующий механизм фильтрует неэффективные сигналы и имеет высокую победоспособность. Простая настройка параметров также позволяет легко освоить ее.
- 1