Бычьи и медвежьи стратегии, основанные на внутренних каналах колебаний цен

Обзор
Эта стратегия использует внутренние каналы цены, чтобы определить будущее движение цены, и относится к стратегии отслеживания тенденции. Когда цены образуют определенное количество внутренних каналов колебаний цены, она рассматривается как сигнал перехода в тренд, совершается операция по покупке или продаже. Вместе с тем, в сочетании с фильтрацией движущейся средней и установкой стоп-стопа для блокировки прибыли, она относится к более распространенным количественным торговым стратегиям.
Стратегический принцип
Эта стратегия определяет формирование внутреннего канала, основываясь на величине отношения между максимальной ценой и минимальной ценой двух последовательных K-линий. Цена определяется как внутренний канал, когда определенное количество K-линий удовлетворяет условию, что максимальная цена ниже максимальной цены предыдущей K-линии, а минимальная цена выше минимальной цены предыдущей K-линии.
При определении того, как формируется внутренний канал цены, стратегия также определяет направление этого внутреннего канала. Если это позитивный внутренний канал, то это создает сигнал покупки; если это падений внутренний канал, то это создает сигнал продажи. Таким образом, эта стратегия относится к двусторонней торговой стратегии.
Для фильтрации ложных сигналов в стратегии также внедрены индикаторы движущихся средних. Фактический торговый сигнал будет производиться только тогда, когда цена будет выше или ниже движущейся средней. Это позволит в некоторой степени избежать ошибочных сделок при урегулировании рынка.
После входа в игру, стратегия также устанавливает стоп-стоп, в зависимости от выбора пользователя. Есть три варианта стоп-стоп: фиксированный стоп-стоп, ATR-стоп-стоп, предыдущий максимум-минимум-стоп-стоп. Стоп-стоп устанавливается для остановки доли возврата риска. Это может в определенной степени блокировать прибыль и контролировать риск.
Анализ преимуществ
Самым большим преимуществом этой стратегии является высокая способность идентифицировать переломные моменты в тренде. Когда цены образуют определенное количество внутренних каналов, это часто указывает на то, что в ближайшее время произойдет большое падение. Это суждение очень согласуется с традиционной теорией технического анализа.
Кроме того, стратегия сама по себе является очень конфигурируемой. Пользователь может свободно выбирать параметры, такие как количество внутренних каналов, циклы движущихся средних, метод остановки убытков. Это обеспечивает большую гибкость для разных видов и стилей торговли.
Наконец, добавленные в стратегию фильтрации движущихся средних и параметры стоп-стоп также значительно снижают риск торговли. Это позволяет стратегии применяться для торговли в различных рыночных условиях.
Анализ рисков
Самый большой риск этой стратегии заключается в том, что вероятность ошибки в определении тренда выше. Внутренние каналы не могут полностью определить обратную сторону цены, существует определенная вероятность ошибочного суждения. Если количество определенных сигналов недостаточно, могут возникнуть случаи ложного сигнала.
Кроме того, эта стратегия совершенно не применима в рыночной консолидации или волатильности. Когда цена колеблется вверх и вниз, но не устанавливает тенденцию, эта стратегия будет последовательно генерировать ошибочные сигналы. Это определяется механизмом стратегии.
Наконец, слишком консервативная стоп-стратегия также может привести к тому, что стратегия не сможет удерживаться достаточно долго и не сможет поймать прибыль в большом тренде. Это требует от пользователя самостоятельной взвешивания настройки.
Направление оптимизации
Однако есть много возможностей для оптимизации этой стратегии. Некоторые возможные направления оптимизации включают:
-
Оптимизация количества и формы внутренних каналов. Эффективность транзакций может быть протестирована в разных количествах или в различных комбинациях.
-
Оптимизация циклических параметров движущихся средних, чтобы они могли лучше определять направление тенденций.
-
Добавление других индикаторных фильтров. Например, введение буринской полосы, которая создает торговый сигнал только в том случае, если цена прорывает буринскую полосу вверх или вниз.
-
Оптимизация стоп-стоп параметров, позволяющая стратегии держать позиции в течение более длительного периода времени. Таким образом, они захватывают прибыль в супер-тренде.
В целом, стратегия существует благодаря ее точности в определении тенденций. При условии, что точность суждения гарантируется, а также при соответствующих настройках управления рисками, можно совершать эффективные алгоритмические сделки.
Подвести итог
Эта стратегия в целом является количественной торговой стратегией, основанной на внутренних каналах цен, которая определяет будущие ценовые тенденции. Она сочетает в себе два метода определения: отслеживание тенденции и обратный тренд, и имеет определенные преимущества.
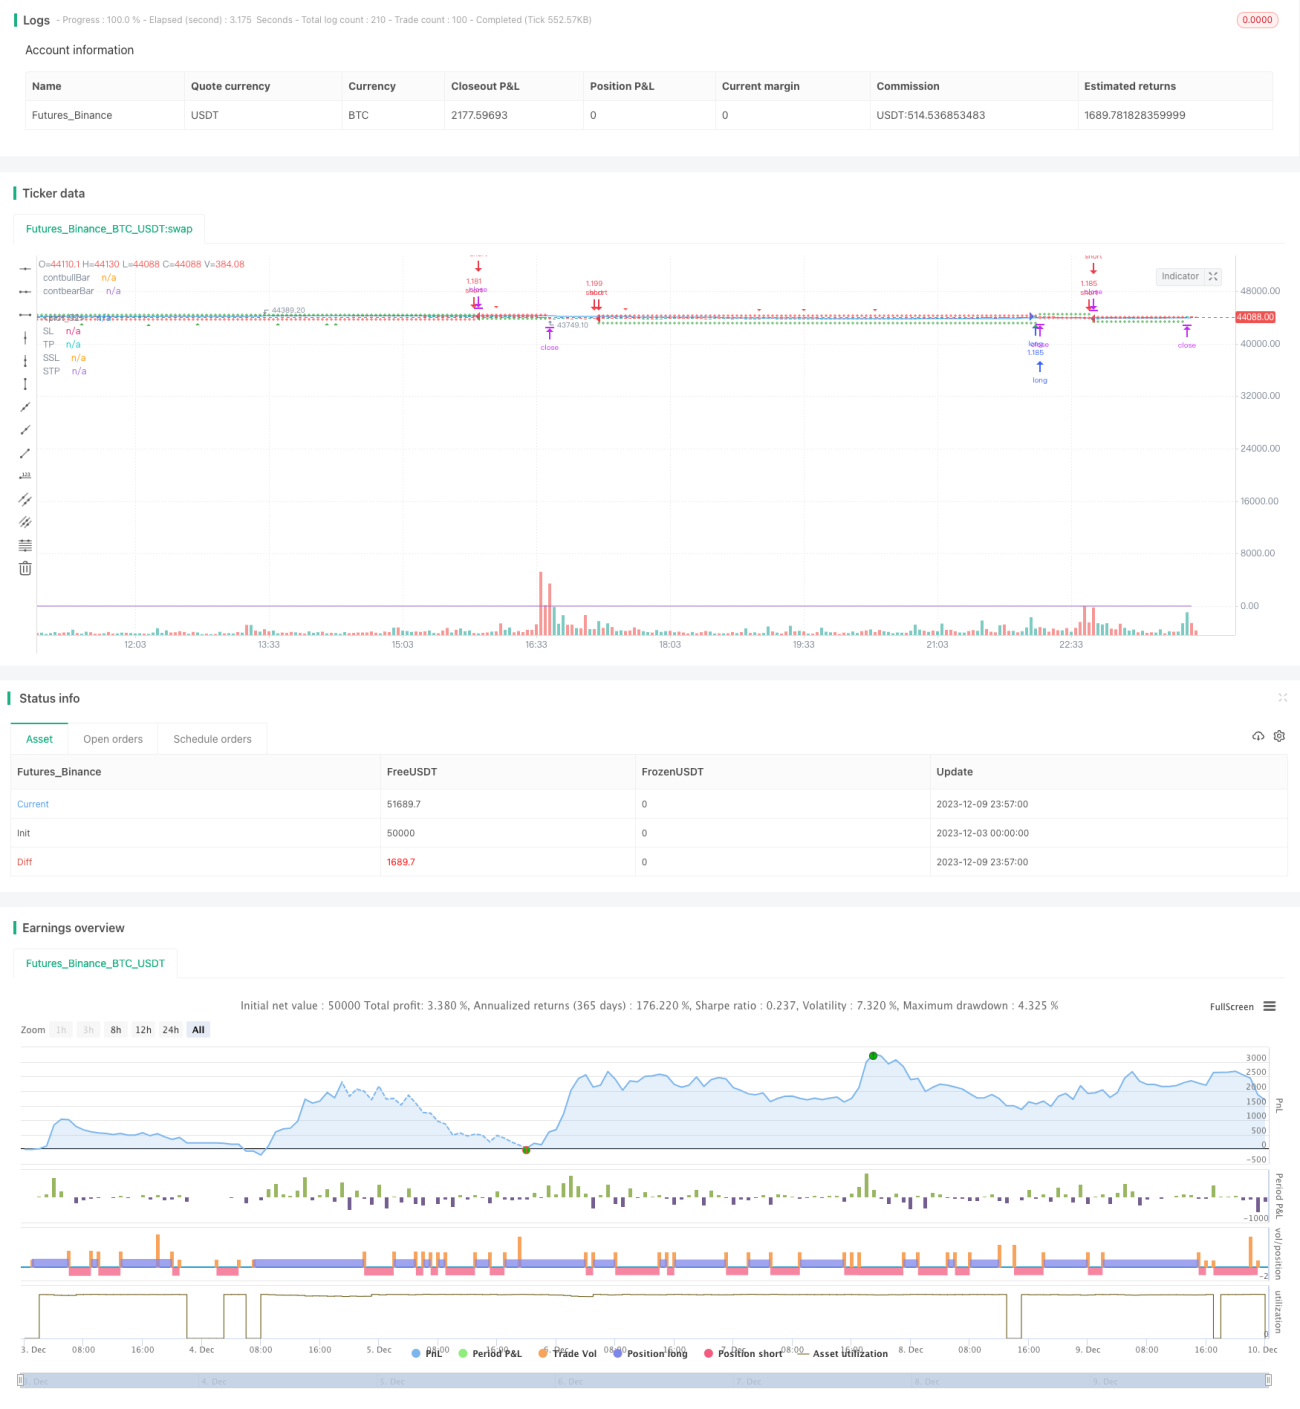
/*backtest
start: 2023-12-03 00:00:00
end: 2023-12-10 00:00:00
period: 3m
basePeriod: 1m
exchanges: [{"eid":"Futures_Binance","currency":"BTC_USDT"}]
*/

// This source code is subject to the terms of the Mozilla Public License 2.0 at https://mozilla.org/MPL/2.0/

// From "Day Trading Cryptocurrency
// Strategies, Tactics, Mindset, and Tools Required To Build Your - 1