
Стратегия, основанная на методе ядерной регрессии Надарайя-Уотсона, создает динамическую волатильность вокруг пояса, чтобы отслеживать пересечение цены и вокруг пояса для достижения торговых сигналов с низкой ценой. Стратегия имеет математическую аналитическую основу и может самостоятельно адаптироваться к изменениям рынка.
В основе стратегии лежит вычисление динамических окружающих поясов цен. Во-первых, построение Nadaraya-Watson Nuclear Regression Curve с ценой ((закрытие, максимум, минимум) в соответствии с определенным периодом отсчета, получение сглаженной оценки цен. Затем вычисление ATR-индикатора на основе определенной длины ATR, в сочетании с коэффициентами ближнего и дальнего конца, получение диапазона верхнего и нижнего окружающих поясов.
В основном, эти риски можно избежать и уменьшить, оптимизируя параметры, хорошо отслеживая, понимая факторы влияния и соблюдая осторожность.
Стратегия объединяет статистический анализ с анализом технических показателей, динамически отслеживая цены и волатильность, для достижения торговых сигналов с низкой ценой. Параметры могут быть скорректированы в зависимости от рынка и собственных обстоятельств. В целом, теоретическая основа стратегии прочна, практическая производительность еще предстоит проверить.
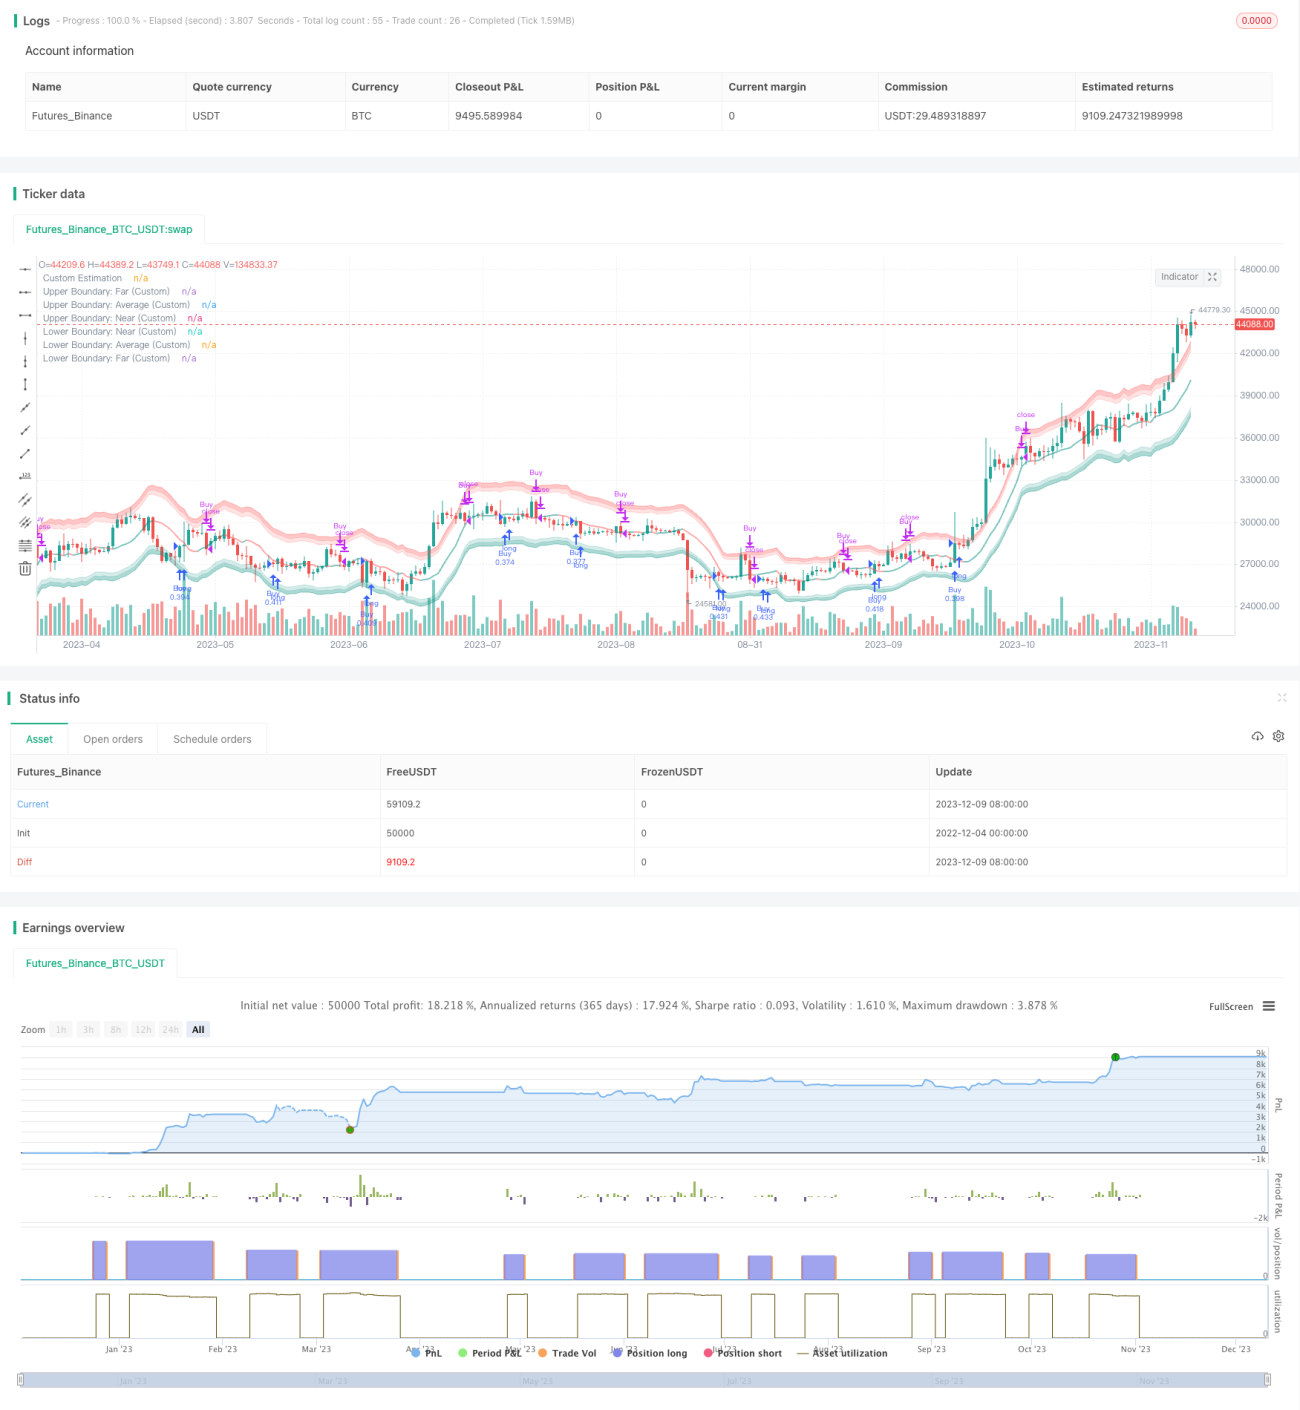
/*backtest
start: 2022-12-04 00:00:00
end: 2023-12-10 00:00:00
period: 1d
basePeriod: 1h
exchanges: [{"eid":"Futures_Binance","currency":"BTC_USDT"}]
*/
// © Julien_Eche
//@version=5
strategy("Nadaraya-Watson Envelope Strategy", overlay=true, pyramiding=1, default_qty_type=strategy.percent_of_equity, default_qty_value=20)
// Helper Functions
getEnvelopeBounds(_atr, _nearFactor, _farFactor, _envelope) =>
_upperFar = _envelope + _farFactor*_atr
_upperNear = _envelope + _nearFactor*_atr
_lowerNear = _envelope - _nearFactor*_atr
_lowerFar = _envelope - _farFactor*_atr
_upperAvg = (_upperFar + _upperNear) / 2
_lowerAvg = (_lowerFar + _lowerNear) / 2
[_upperNear, _upperFar, _upperAvg, _lowerNear, _lowerFar, _lowerAvg]
customATR(length, _high, _low, _close) =>
trueRange = na(_high[1])? math.log(_high)-math.log(_low) : math.max(math.max(math.log(_high) - math.log(_low), math.abs(math.log(_high) - math.log(_close[1]))), math.abs(math.log(_low) - math.log(_close[1])))
ta.rma(trueRange, length)
customKernel(x, h, alpha, x_0) =>
sumWeights = 0.0
sumXWeights = 0.0
for i = 0 to h
weight = math.pow(1 + (math.pow((x_0 - i), 2) / (2 * alpha * h * h)), -alpha)
sumWeights := sumWeights + weight
sumXWeights := sumXWeights + weight * x[i]
sumXWeights / sumWeights
// Custom Settings
customLookbackWindow = input.int(8, 'Lookback Window (Custom)', group='Custom Settings')
customRelativeWeighting = input.float(8., 'Relative Weighting (Custom)', step=0.25, group='Custom Settings')
customStartRegressionBar = input.int(25, "Start Regression at Bar (Custom)", group='Custom Settings')
// Envelope Calculations
customEnvelopeClose = math.exp(customKernel(math.log(close), customLookbackWindow, customRelativeWeighting, customStartRegressionBar))
customEnvelopeHigh = math.exp(customKernel(math.log(high), customLookbackWindow, customRelativeWeighting, customStartRegressionBar))
customEnvelopeLow = math.exp(customKernel(math.log(low), customLookbackWindow, customRelativeWeighting, customStartRegressionBar))
customEnvelope = customEnvelopeClose
customATRLength = input.int(60, 'ATR Length (Custom)', minval=1, group='Custom Settings')
customATR = customATR(customATRLength, customEnvelopeHigh, customEnvelopeLow, customEnvelopeClose)
customNearATRFactor = input.float(1.5, 'Near ATR Factor (Custom)', minval=0.5, step=0.25, group='Custom Settings')
customFarATRFactor = input.float(2.0, 'Far ATR Factor (Custom)', minval=1.0, step=0.25, group='Custom Settings')
[customUpperNear, customUpperFar, customUpperAvg, customLowerNear, customLowerFar, customLowerAvg] = getEnvelopeBounds(customATR, customNearATRFactor, customFarATRFactor, math.log(customEnvelopeClose))
// Colors
customUpperBoundaryColorFar = color.new(color.red, 60)
customUpperBoundaryColorNear = color.new(color.red, 80)
customBullishEstimatorColor = color.new(color.teal, 50)
customBearishEstimatorColor = color.new(color.red, 50)
customLowerBoundaryColorNear = color.new(color.teal, 80)
customLowerBoundaryColorFar = color.new(color.teal, 60)
// Plots
customUpperBoundaryFar = plot(math.exp(customUpperFar), color=customUpperBoundaryColorFar, title='Upper Boundary: Far (Custom)')
customUpperBoundaryAvg = plot(math.exp(customUpperAvg), color=customUpperBoundaryColorNear, title='Upper Boundary: Average (Custom)')
customUpperBoundaryNear = plot(math.exp(customUpperNear), color=customUpperBoundaryColorNear, title='Upper Boundary: Near (Custom)')
customEstimationPlot = plot(customEnvelopeClose, color=customEnvelope > customEnvelope[1] ? customBullishEstimatorColor : customBearishEstimatorColor, linewidth=2, title='Custom Estimation')
customLowerBoundaryNear = plot(math.exp(customLowerNear), color=customLowerBoundaryColorNear, title='Lower Boundary: Near (Custom)')
customLowerBoundaryAvg = plot(math.exp(customLowerAvg), color=customLowerBoundaryColorNear, title='Lower Boundary: Average (Custom)')
customLowerBoundaryFar = plot(math.exp(customLowerFar), color=customLowerBoundaryColorFar, title='Lower Boundary: Far (Custom)')
// Fills
fill(customUpperBoundaryFar, customUpperBoundaryAvg, color=customUpperBoundaryColorFar, title='Upper Boundary: Farmost Region (Custom)')
fill(customUpperBoundaryNear, customUpperBoundaryAvg, color=customUpperBoundaryColorNear, title='Upper Boundary: Nearmost Region (Custom)')
fill(customLowerBoundaryNear, customLowerBoundaryAvg, color=customLowerBoundaryColorNear, title='Lower Boundary: Nearmost Region (Custom)')
fill(customLowerBoundaryFar, customLowerBoundaryAvg, color=customLowerBoundaryColorFar, title='Lower Boundary: Farmost Region (Custom)')
longCondition = ta.crossover(close, customEnvelopeLow)
if (longCondition)
strategy.entry("Buy", strategy.long)
exitLongCondition = ta.crossover(customEnvelopeHigh, close)
if (exitLongCondition)
strategy.close("Buy")