Количественная торговая стратегия с использованием нескольких технических индикаторов
Обзор
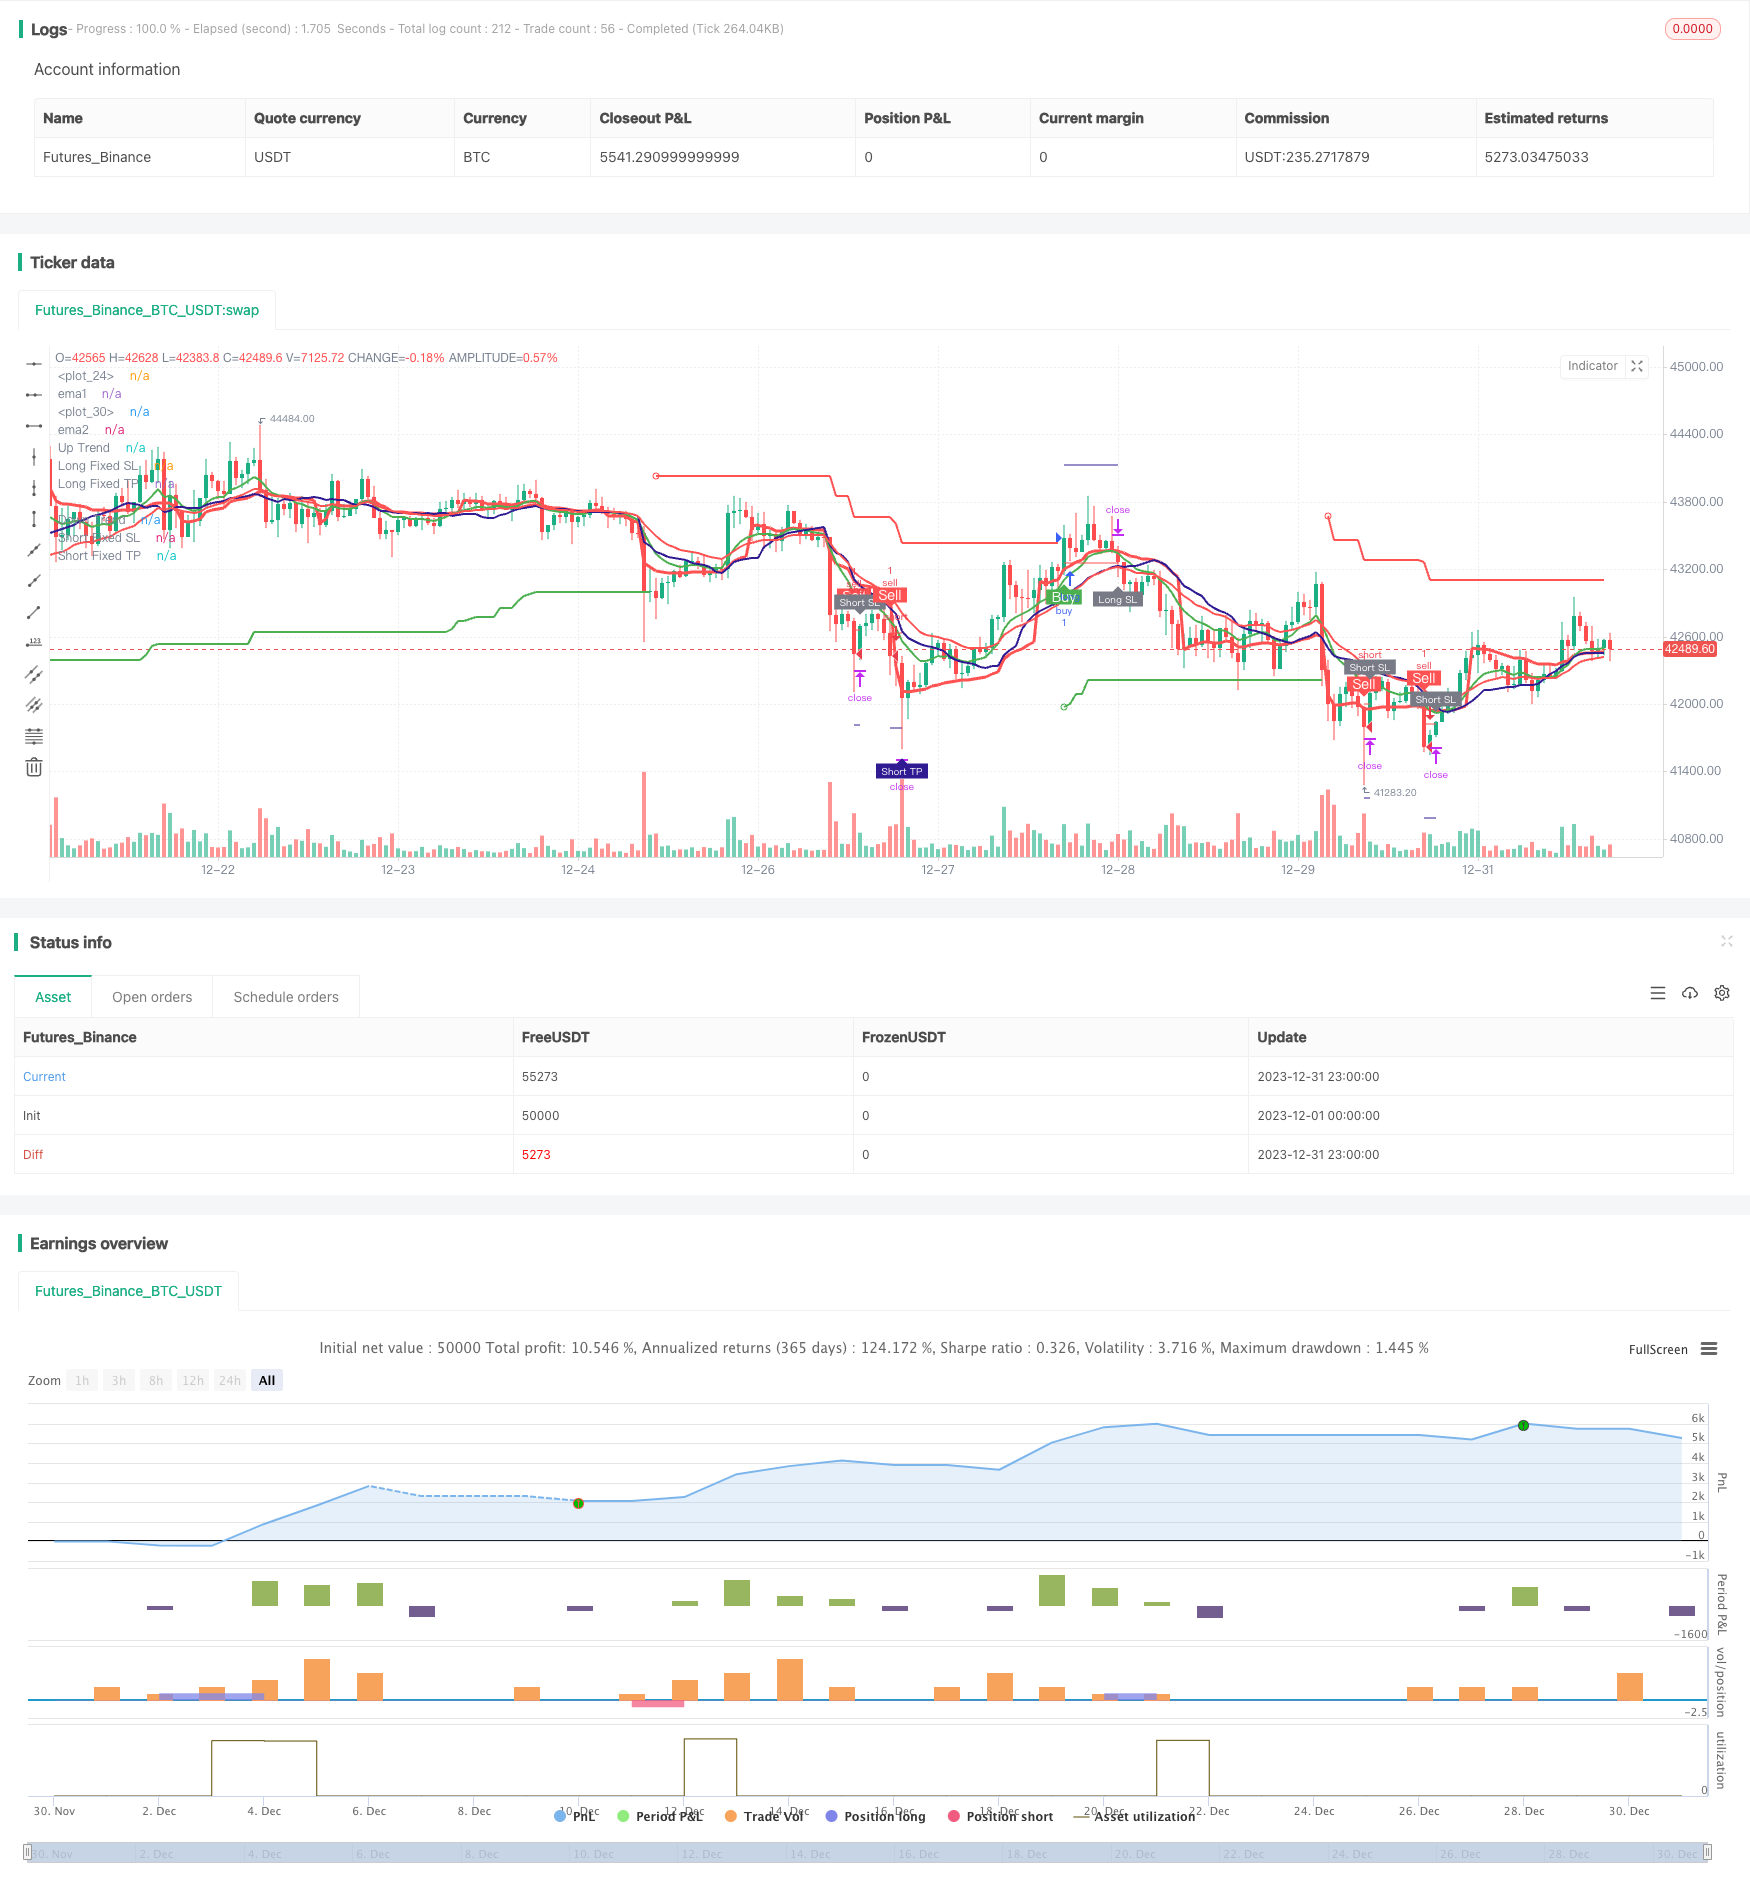
Эта стратегия - это стратегия количественного трейдинга с использованием нескольких технических индикаторов. В основном используются различные индикаторы, такие как пересечение средней линии EMA, индикатор SuperTrend, индикатор RSI, индикатор MACD, для создания торговых сигналов.
Стратегический принцип
Основная логика сделки в этой стратегии состоит из следующих аспектов:
EMA среднелинейный перекрестный: вычислить быструю линию EMA1 и медленную линию EMA2, когда быстрая линия при прохождении медленной линии генерирует сигнал покупки, а при прохождении медленной линии под быстрой линией генерирует сигнал продажи.
Средняя линия VWMA: рассчитывается средняя линия VWMA, которая считается сигналом покупки, когда она пересекает среднюю линию в верхней части цены закрытия, и сигналом продажи, когда она пересекает среднюю линию в нижней части.
Индикатор SuperTrend: рассчитывает взлеты и падения SuperTrend на основе ATR и мультипликатора и определяет направление тренда. Вызывает сигнал покупки в восходящем тренде и сигнал продажи в нисходящем тренде.
RSI: RSI рассчитывается, когда RSI выше линейки перепродажи и RSI ниже линейки перепродажи.
MACD-индикатор: рассчитывает MACD на быстром, медленном и сигнальном направлениях, по которым при прохождении сигнального направления на быстром направлении образуется сигнал покупки, а при прохождении сигнального направления под быстрым направлением образуется сигнал продажи.
После получения торговых сигналов для вышеуказанных нескольких индикаторов стратегия использует логику AND, то есть создает окончательные сигналы покупки и продажи только тогда, когда несколько индикаторов одновременно испускают сигналы.
Стратегические преимущества
Эта стратегия объединяет в себе несколько показателей, позволяющих оценить рынок и эффективно сократить количество ложных сигналов. Основные преимущества включают в себя:
Комбинированная фильтрация с использованием нескольких показателей позволяет уменьшить ошибочный сигнал, вызванный одним показателем.
В сочетании с индикаторами тренда и шока можно получить дополнительную прибыль в условиях тренда.
Используя совершенную логику Stop Loss, можно эффективно контролировать максимальный убыток от одной сделки.
Логика двойного ставки позволяет получить выигрыш через увеличение позиции после убытка.
Стратегический риск
Основные риски этой стратегии:
Портфель с несколькими показателями может быть слишком консервативным и упускать некоторые торговые возможности. Портфель показателей может быть соответствующим образом упрощен.
Логика двойного ставки может привести к увеличению убытков. Следует разумно установить ограничение на количество пополнений.
Неправильная настройка места остановки может привести к ненужной остановке. Следует настроить адаптивное место остановки.
Неправильная настройка параметров индикатора может привести к созданию слишком много ошибочных сигналов. Параметры следует оптимизировать, чтобы получить оптимальную комбинацию параметров.
Направление оптимизации стратегии
Эта стратегия может быть улучшена в следующих аспектах:
Оценить эффективность различных комбинаций параметров, выбрать вес для показателя.
Тестирование различных параметров показателя.
Добавление адаптивной логики стоп-убытков.
Присоединение к механизму управления динамическими позициями.
Оптимизация параметров и моделей с использованием методов машинного обучения.
Подвести итог
Эта стратегия является очень практичной количественной торговой стратегией. Она объединяет преимущества многих классических технических показателей, которые позволяют эффективно проводить рыночные суждения. Эта стратегия может получить лучшую эффективность торговли путем оптимизации параметров и моделирования.
/*backtest
start: 2023-12-01 00:00:00
end: 2023-12-31 23:59:59
period: 1h
basePeriod: 15m
exchanges: [{"eid":"Futures_Binance","currency":"BTC_USDT"}]
*/


//@version=5
strategy(title='Pinku Buy', overlay=true)

fromMonth = input.int(defval=1, title='From Month', minval=1, maxval=12)
fromDay = input.int(defval=1, title='From Day', minval=1, maxval=31)
fromYear = input.int(defval=2021, title='From Year', minval=1970)
thruMonth = input.int(defval=1, title='Thru Month', minval=1, maxval=12)
thruDay = input.int(defval=1, title='Thru Day', minval=1, maxval=31)
thruYear = input.int(defval=2112, title='Thru Year', minval=1970)

showDate = input(defval=true, title='Show Date Range')

start = timestamp(fromYear, fromMonth, fromDay, 00, 00)
finish = timestamp(thruYear, thruMonth, thruDay, 23, 59)
window() => true
// ema crossover
length1 = input.int(10)
length2 = input.int(20)
ema1 = ta.ema(close , length1)
ema2 = ta.ema(close , length2)
//vwap
VWAP = ta.vwap(hlc3)
plot(VWAP, color=color.new(color.red, 0), linewidth=3)
buy_1 = close > VWAP
sell_1 = close < VWAP
//vwma
len = input.int(20, 'VWMA_len', minval=1)
ma = ta.vwma(close, len)
plot(ma, color=color.new(color.navy, 0), linewidth=2)
buy_2 = close > ma
sell_2 = close < ma
//super trend
//inputs
Periods = input(title='STR Period', defval=22)
Source = input(hl2, title='Source')
Multiplier = input.float(title='STR Multiplier', step=0.1, defval=5.0)


//Compute ATR Levels
atr = ta.atr(Periods)


//Creating Upper Channel

up = Source - Multiplier * atr
up1 = nz(up[1], up)
up := close[1] > up1 ? math.max(up, up1) : up

//Creating Down Channel
dn = Source + Multiplier * atr
dn1 = nz(dn[1], dn)
dn := close[1] < dn1 ? math.min(dn, dn1) : dn


//Compute the Trend Stream +1/-1
trend = 1
trend := nz(trend[1], trend)
trend := trend == -1 and close > dn1 ? 1 : trend == 1 and close < up1 ? -1 : trend

//Create Stoploss for Longs
upPlot = plot(trend == 1 ? up : na, title='Up Trend', style=plot.style_linebr, linewidth=2, color=color.new(color.green, 0))
//buy_a = close > upPlot
//Buy Signal
buy_3 = trend == 1 and trend[1] == -1

plotshape(buy_3 ? up : na, title='Go Long', location=location.absolute, style=shape.circle, size=size.tiny, color=color.new(color.green, 0))

dnPlot = plot(trend == 1 ? na : dn, title='Down Trend', style=plot.style_linebr, linewidth=2, color=color.new(color.red, 0))
//sell_a = close < dnPlot
//Sell Signal
sell_3 = trend == -1 and trend[1] == 1

plotshape(sell_3 ? dn : na, title='Go Short', location=location.absolute, style=shape.circle, size=size.tiny, color=color.new(color.red, 0))
// //paraboloic sar
// start = input(0.02)
// increment = input(0.02)
// maximum = input(0.2, 'Max Value')
// out = ta.sar(start, increment, maximum)


buy_4 = ema1 > ema2
//buy_4 = buy1 and not buy1[1]
//plotshape(buy_4 , color = color.green , text = "Buy" , location = location.belowbar , textcolor = color.white , style = shape.labelup , size = size.small)
sell_4 = close < ema2
//sell_4 = sell1 and not sell1[1]
//plotshape(sell_4, color = color.red , text = "Sell" , location = location.abovebar , textcolor = color.white , style = shape.labeldown , size = size.small)
plot(ema1, 'ema1', color=color.new(color.green, 0), linewidth=2)
plot(ema2, 'ema2', color=color.new(color.red, 0), linewidth=2)

// rsi
lenr = input(14, title='Rsi Period')
rs = ta.rsi(close, lenr)

over_sold = input(44)
over_bought = input(56)

buy_5 = rs > over_bought
sell_5 = rs < over_sold
// macd
slow_len_macd = input.int(12)
fast_len_macd = input.int(26)
signal_len_macd = input.int(9)

ema3 = ta.ema(close , slow_len_macd)
ema4 = ta.ema(close , fast_len_macd)
ema5 = ta.ema(close , signal_len_macd)

buy_6 = ema5 > ema4
sell_6 = ema5 < ema4

// adx
adxlen = input(14, title="ADX Smoothing")
dilen = input(14, title="DI Length")
dirmov(len) =>
	up = ta.change(high)
	down = -ta.change(low)
	plusDM = na(up) ? na : (up > down and up > 0 ? up : 0)
	minusDM = na(down) ? na : (down > up and down > 0 ? down : 0)
	truerange = ta.rma(ta.tr, len)
	plus = fixnan(100 * ta.rma(plusDM, len) / truerange)
	minus = fixnan(100 * ta.rma(minusDM, len) / truerange)
	[plus, minus]
adx(dilen, adxlen) =>
	[plus, minus] = dirmov(dilen)
	sum = plus + minus
	adx = 100 * ta.rma(math.abs(plus - minus) / (sum == 0 ? 1 : sum), adxlen)
sig = adx(dilen, adxlen)
//plot(sig, color=color.red, title="ADX")
adx_Greater_than = input.int(25)

signal = sig > adx_Greater_than
// volume ema
volume_ema = input.int(10)

vema = ta.ema(volume,volume_ema)

signal_2 = volume > vema


//define buy sell
g = buy_1 and buy_2 and buy_4 and trend == 1 and buy_5 and buy_6 and signal and signal_2 and window()
r = sell_1 and sell_2 and sell_4 and trend == -1 and sell_5 and sell_6 and signal and signal_2 and window()

rg = 0
rg := r ? 1 : g ? 2 : nz(rg[1])

buy11 = 0
buy11 := r ? 0 : g ? 1 : nz(buy11[1])
sell11 = 0
sell11 := r ? 1 : g ? 0 : nz(sell11[1])

buy = buy11 and not buy11[1]
sell = sell11 and not sell11[1]
multiple_signals = input(true)

if multiple_signals
    buy := g and not g[1] and  window()
    sell := r and not r[1] and  window()
    sell
else
    buy := buy and window()
    sell := sell and window()
    sell


//plotshape(long  , color = color.green , text = "Buy" , location = location.belowbar , textcolor = color.white , style = shape.labelup , size = size.small)
//plotshape(short   , color = color.red , text = "Sell" , location = location.abovebar , textcolor = color.white , style = shape.labeldown , size = size.small)
Stop = input(0.5, title='StopLoss') / 100

ProfitPerc = input(defval=1.5, title='Profit') / 100

rev = input(1024,title = "Reverse Limit")

Averaging_position_ = input(true , title = "Averaging position ? ")

qn = 1
qn := nz(qn[1])


long_short = 0
long_last = buy and (nz(long_short[1]) == 0 or nz(long_short[1]) == -1)
short_last = sell and (nz(long_short[1]) == 0 or nz(long_short[1]) == 1)
long_short := long_last ? 1 : short_last ? -1 : long_short[1]

long_entered = false
long_entered := long_entered[1]

short_entered = false
short_entered := short_entered[1]


longPrice = ta.valuewhen(long_last, close, 0)
shortPrice = ta.valuewhen(short_last, close, 0)


longStop = longPrice * (1 - Stop)
shortStop = shortPrice * (1 + Stop)
longTake = longPrice * (1 + ProfitPerc)
shortTake = shortPrice * (1 - ProfitPerc)
plot(long_short == 1 ? longStop : na, style=plot.style_linebr, color=color.new(color.red, 0), linewidth=1, title='Long Fixed SL')
plot(long_short == -1 ? shortStop : na, style=plot.style_linebr, color=color.new(color.red, 0), linewidth=1, title='Short Fixed SL')
plot(long_short == 1 ? longTake : na, style=plot.style_linebr, color=color.new(color.navy, 0), linewidth=1, title='Long Fixed TP')


plot(long_short == -1 ? shortTake : na, style=plot.style_linebr, color=color.new(color.navy, 0), linewidth=1, title='Short Fixed TP')


longBar1 = ta.barssince(long_last)
longBar2 = longBar1 >= 1 ? true : false
shortBar1 = ta.barssince(short_last)
shortBar2 = shortBar1 >= 1 ? true : false

longSLhit = long_short == 1 and longBar2 and low < longStop

if long_entered and sell
    longSLhit := true
    longSLhit

plotshape(longSLhit and not(sell and not short_entered and long_entered), style=shape.labelup, location=location.belowbar, color=color.new(color.gray, 0), size=size.tiny, title='Stop Loss', text='Long SL', textcolor=color.new(color.white, 0))
shortSLhit = long_short == -1 and shortBar2 and high > shortStop


if short_entered and buy
    shortSLhit := true
    shortSLhit

plotshape(shortSLhit and not(buy and not long_entered and short_entered), style=shape.labeldown, location=location.abovebar, color=color.new(color.gray, 0), size=size.tiny, title='Stop Loss', text='Short SL', textcolor=color.new(color.white, 0))


longTPhit = long_short == 1 and longBar2 and high > longTake
plotshape(longTPhit, style=shape.labeldown, location=location.abovebar, color=color.new(color.navy, 0), size=size.tiny, title='Target', text='Long TP', textcolor=color.new(color.white, 0))
shortTPhit = long_short == -1 and shortBar2 and low < shortTake
plotshape(shortTPhit, style=shape.labelup, location=location.belowbar, color=color.new(color.navy, 0), size=size.tiny, title='Target', text='Short TP', textcolor=color.new(color.white, 0))

long_short := (long_short == 1 or long_short == 0) and longBar2 and (longSLhit or longTPhit) ? 0 : (long_short == -1 or long_short == 0) and shortBar2 and (shortSLhit or shortTPhit) ? 0 : long_short

if(shortSLhit or longSLhit or (long_entered[1] and sell) or (short_entered[1] and buy ))
    qn := qn*2

if(longTPhit or shortTPhit or qn > rev)
    qn := 1

if Averaging_position_
    qn := 1

plotshape(buy and not long_entered, color=color.new(color.green, 0), style=shape.labelup, text='Buy', textcolor=color.new(color.white, 0), location=location.belowbar)
plotshape(sell and not short_entered, color=color.new(color.red, 0), style=shape.labeldown, text='Sell', textcolor=color.new(color.white, 0), location=location.abovebar)


// plotshape(buy and not(long_entered) and (short_entered), color = color.green , style = shape.labelup , text = "FA Buy" , textcolor = color.white , location = location.belowbar)
// plotshape(sell and not(short_entered)  and (long_entered), color = color.red , style = shape.labeldown , text = "FA Sell" , textcolor = color.white , location = location.abovebar)


// alertcondition(condition=buy and  not(long_entered)  and (short_entered), title="Fully Algo Buy")
// alertcondition(condition=sell and  not(short_entered)  and (long_entered), title="Fully Algo sell")

alertcondition(condition=buy and not long_entered, title='Buy')
alertcondition(condition=sell and not short_entered, title='Sell')

if long_last
    long_entered := true
    short_entered := false
    short_entered
if short_last
    short_entered := true
    long_entered := false
    long_entered

alertcondition(condition=longSLhit and not(sell and not short_entered and long_entered), title='Long SL')
alertcondition(condition=shortSLhit and not(buy and not long_entered and short_entered), title='Short SL')

alertcondition(condition=longTPhit, title='Long TP')
alertcondition(condition=shortTPhit, title='Short TP')

if longSLhit or longTPhit
    long_entered := false
    long_entered

if shortSLhit or shortTPhit
    short_entered := false
    short_entered

// if buy
//     strategy.entry('buy', strategy.long)
//     strategy.exit('exit', 'buy', limit=longTake, stop=longStop)


// if sell
//     strategy.entry('sell', strategy.short)
//     strategy.exit('exit', 'sell', limit=shortTake, stop=shortStop)
if(buy)
    strategy.entry("buy",strategy.long,qty = qn)
    strategy.exit("Stop","buy",limit = longTake,stop = longStop)

if(sell)
    strategy.entry("sell",strategy.short,qty = qn)
    strategy.exit("Stop","sell",limit = shortTake,stop = shortStop)

strategy.close("buy",when =  longTPhit or sell or longSLhit, comment = "Target")
strategy.close("sell",when =  shortSLhit or shortTPhit or buy , comment = "Stop Loss")

strategy.cancel("buy",when =  longTPhit or sell or longSLhit)
strategy.cancel("sell",when =  shortSLhit or shortTPhit or buy )