حرکت پذیری اوسط پر مبنی مقداری تجارتی حکمت عملی
جائزہ
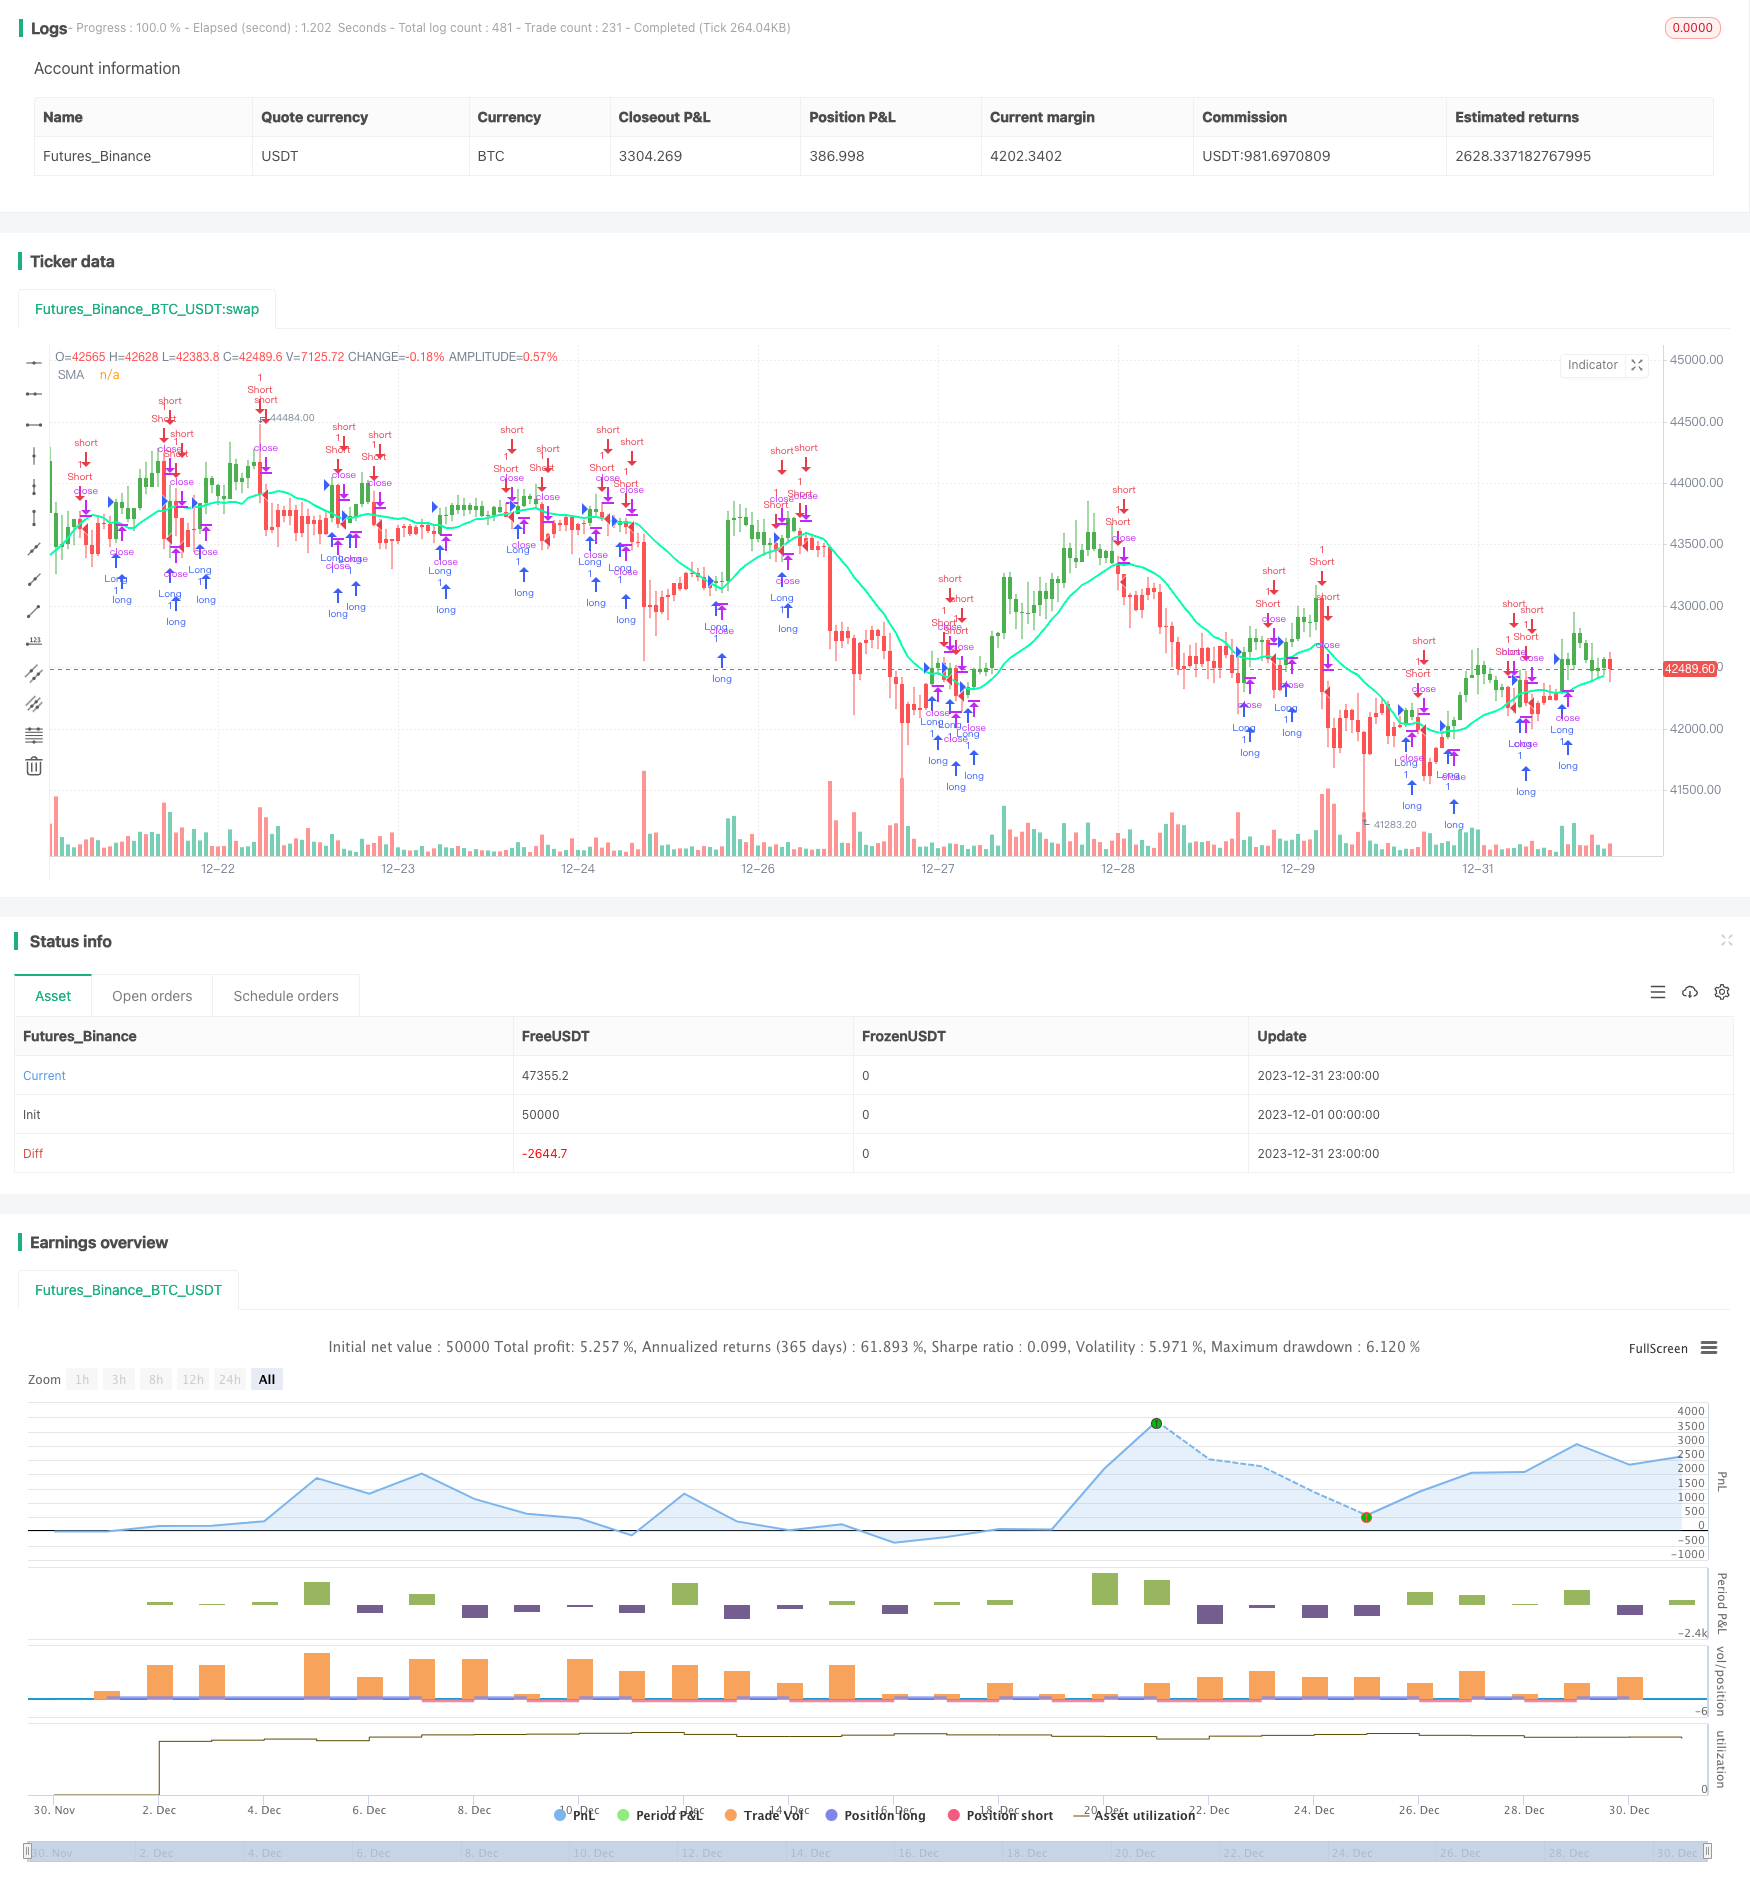
ایک متحرک اوسط کراسنگ حکمت عملی ایک متحرک اوسط پر مبنی ایک مقداری تجارت کی حکمت عملی ہے۔ یہ حکمت عملی تجارت کے اشارے پیدا کرنے کے لئے ایک وقت کے دوران سیکیورٹی کی اوسط قیمت کا حساب لگانے کے ذریعے منافع بخش ہے ، قیمتوں کی متحرک اوسط کی کراسنگ کا استعمال کرتے ہوئے۔
حکمت عملی کا اصول
یہ حکمت عملی بنیادی طور پر قیمت کے رجحانات کا تعین کرنے اور تجارتی سگنل پیدا کرنے کے لئے تیز رفتار اور سست رفتار اوسط اوسط کی کراسنگ کا استعمال کرتی ہے۔ خاص طور پر ، دو مختلف دورانیوں کی لمبائی والی اوسط اوسط کا استعمال کرتے ہوئے ، جیسے 10 دن کی لائن اور 20 دن کی لائن۔
جب فاسٹ منتقل اوسط نیچے کی طرف سے سست منتقل اوسط توڑنے کے لئے، اس کے بازار کی طرف سے نیچے کی طرف سے نیچے کی طرف سے منتقل کرنے کے لئے، ایک خرید سگنل پیدا کرنے کے لئے سمجھا جاتا ہے. جب فاسٹ منتقل اوسط اوپر کی طرف سے نیچے کی طرف سے سست منتقل اوسط توڑنے کے لئے، اس کے بازار کی طرف سے نیچے کی طرف سے منتقل کرنے کے لئے، ایک فروخت سگنل پیدا کرنے کے لئے سمجھا جاتا ہے.
قیمتوں کے رجحانات کے ٹرنپوائنٹس کو پکڑنے کے ذریعہ ، یہ حکمت عملی منافع بخش ہونے کے لئے ، بہتر ہونے پر خرید سکتی ہے اور خراب ہونے پر فروخت کرسکتی ہے۔
طاقت کا تجزیہ
یہ حکمت عملی مندرجہ ذیل فوائد رکھتی ہے:
- تصورات سادہ ہیں، سمجھنے میں آسان اور قابل عمل
- متحرک اوسط کے دورانیے کو ایڈجسٹ کرنے کے لئے حسب ضرورت پیرامیٹرز
- رجحان سازی کے لئے خاص طور پر موزوں
- روک تھام کے نقصان کے منطق میں شامل کیا جاسکتا ہے ، خطرے کو کنٹرول کرنا
خطرے کا تجزیہ
اس حکمت عملی میں مندرجہ ذیل خطرات بھی ہیں:
- غلط سگنل اور زیادہ تجارت کے لئے تیار
- پیرامیٹرز کو ڈیبگ کرنے کی ضرورت ہے ، مختلف پیرامیٹرز کے مجموعے میں پیمائش کے نتائج میں بہت زیادہ فرق ہے
- ٹرانزیکشن لاگت اور سلائڈ پوائنٹس کو مدنظر نہ رکھتے ہوئے ، فکسڈ ڈسک کا اثر ممکنہ طور پر پیمائش سے کم ہوسکتا ہے
- ٹائم لیگ کی وجہ سے قیمتوں میں تیزی سے تبدیلی کا موقع ضائع ہوسکتا ہے
ان خطرات کو مناسب اصلاحات کے ذریعے کم کیا جاسکتا ہے۔
اصلاح کی سمت
اس حکمت عملی کو مندرجہ ذیل طریقوں سے بہتر بنایا جاسکتا ہے:
- دوسرے اشارے فلٹر سگنل کے ساتھ مل کر ، جیسے توانائی کی پیمائش ، کمپن کی پیمائش ، وغیرہ ، جوڑے میں غلط تجارت سے بچنے کے لئے
- قیمتوں کو بہتر طور پر ٹریک کرنے کے لئے متحرک پیرامیٹرز کو متحرک کرنے کے لئے ایک لچکدار منتقل اوسط شامل کریں
- بہترین پیرامیٹرز کا مجموعہ تلاش کرنے کے لئے متحرک اوسط کے دورانیہ پیرامیٹرز کو بہتر بنائیں
- بار بار تجارت سے بچنے کے لئے دوبارہ داخلے کی شرائط طے کریں
- اصل ٹرانزیکشن لاگت اور سلائڈ پوائنٹس کو مدنظر رکھتے ہوئے اسٹاپ اور اسٹاپ نقصان کو ایڈجسٹ کریں
مندرجہ بالا اصلاحات سے حکمت عملی کی عملی کارکردگی میں نمایاں بہتری آسکتی ہے۔
خلاصہ کریں۔
ایک متحرک اوسط کراسنگ حکمت عملی مجموعی طور پر ایک ایسی مقدار کی تجارت کی حکمت عملی ہے جس کو سمجھنا اور اس پر عمل درآمد کرنا آسان ہے۔ یہ قیمت کی اوسط کے کراسنگ اصول کو استعمال کرتا ہے ، جس سے مارکیٹ کی حرکت کو آسانی سے اور بصری طور پر فیصلہ کیا جاسکتا ہے اور تجارتی سگنل پیدا کیا جاسکتا ہے۔ پیرامیٹرز کو بہتر بنانے اور دیگر تکنیکی اشارے کے ساتھ مل کر ، اس حکمت عملی کے عملی اثر کو تقویت دی جاسکتی ہے ، جس سے یہ ایک قابل اعتماد مقدار میں منافع بخش آلہ بن جاتا ہے۔
/*backtest
start: 2023-12-01 00:00:00
end: 2023-12-31 23:59:59
period: 1h
basePeriod: 15m
exchanges: [{"eid":"Futures_Binance","currency":"BTC_USDT"}]
*/

// This source code is subject to the terms of the Mozilla Public License 2.0 at https://mozilla.org/MPL/2.0/
// © HPotter
//  Simple SMA strategy
//
// WARNING:
//      - For purpose educate only
//      - This script to change bars colors
//@version=4
strategy(title="Simple SMA Strategy Backtest", shorttitle="SMA Backtest", precision=6, overlay=true)
Resolution = input(title="Resolution", type=input.resolution, defval="D")
Source = input(title="Source", type=input.source, defval=close)
xSeries = security(syminfo.tickerid, Resolution, Source)
Length = input(title="Length", type=input.integer, defval=14, minval=2)
TriggerPrice = input(title="Trigger Price", type=input.source, defval=close)
TakeProfit = input(50, title="Take Profit", step=0.01)
StopLoss = input(20, title="Stop Loss", step=0.01)
UseTPSL = input(title="Use Take\Stop", type=input.bool, defval=false)
BarColors = input(title="Painting bars", type=input.bool, defval=true)
ShowLine = input(title="Show Line", type=input.bool, defval=true)
UseAlerts = input(title="Use Alerts", type=input.bool, defval=false)
reverse = input(title="Trade Reverse", type=input.bool, defval=false)
pos = 0
xSMA = sma(xSeries, Length)
pos := iff(TriggerPrice > xSMA, 1,
         iff(TriggerPrice < xSMA, -1, nz(pos[1], 0)))
nRes = ShowLine ? xSMA : na
alertcondition(UseAlerts == true and pos != pos[1] and pos == 1, title='Signal Buy', message='Strategy to change to BUY')
alertcondition(UseAlerts == true and pos != pos[1] and pos == -1, title='Signal Sell', message='Strategy to change to SELL')
alertcondition(UseAlerts == true and pos != pos[1] and pos == 0, title='FLAT', message='Strategy get out from position')
possig =iff(pos[1] != pos,
         iff(reverse and pos == 1, -1,
           iff(reverse and pos == -1, 1, pos)), 0)
if (possig == 1)
    strategy.entry("Long", strategy.long)
if (possig == -1)
    strategy.entry("Short", strategy.short)

if (UseTPSL)
    strategy.close("Long", when = high > strategy.position_avg_price + TakeProfit, comment = "close buy take profit")
    strategy.close("Long", when = low < strategy.position_avg_price - StopLoss, comment = "close buy stop loss")
    strategy.close("Short", when = low < strategy.position_avg_price - TakeProfit, comment = "close buy take profit")
    strategy.close("Short", when = high > strategy.position_avg_price + StopLoss, comment = "close buy stop loss")
nColor = BarColors ? strategy.position_avg_price != 0  and pos == 1 ? color.green :strategy.position_avg_price != 0 and pos == -1 ? color.red : color.blue : na
barcolor(nColor)
plot(nRes, title='SMA', color=#00ffaa, linewidth=2, style=plot.style_line)