
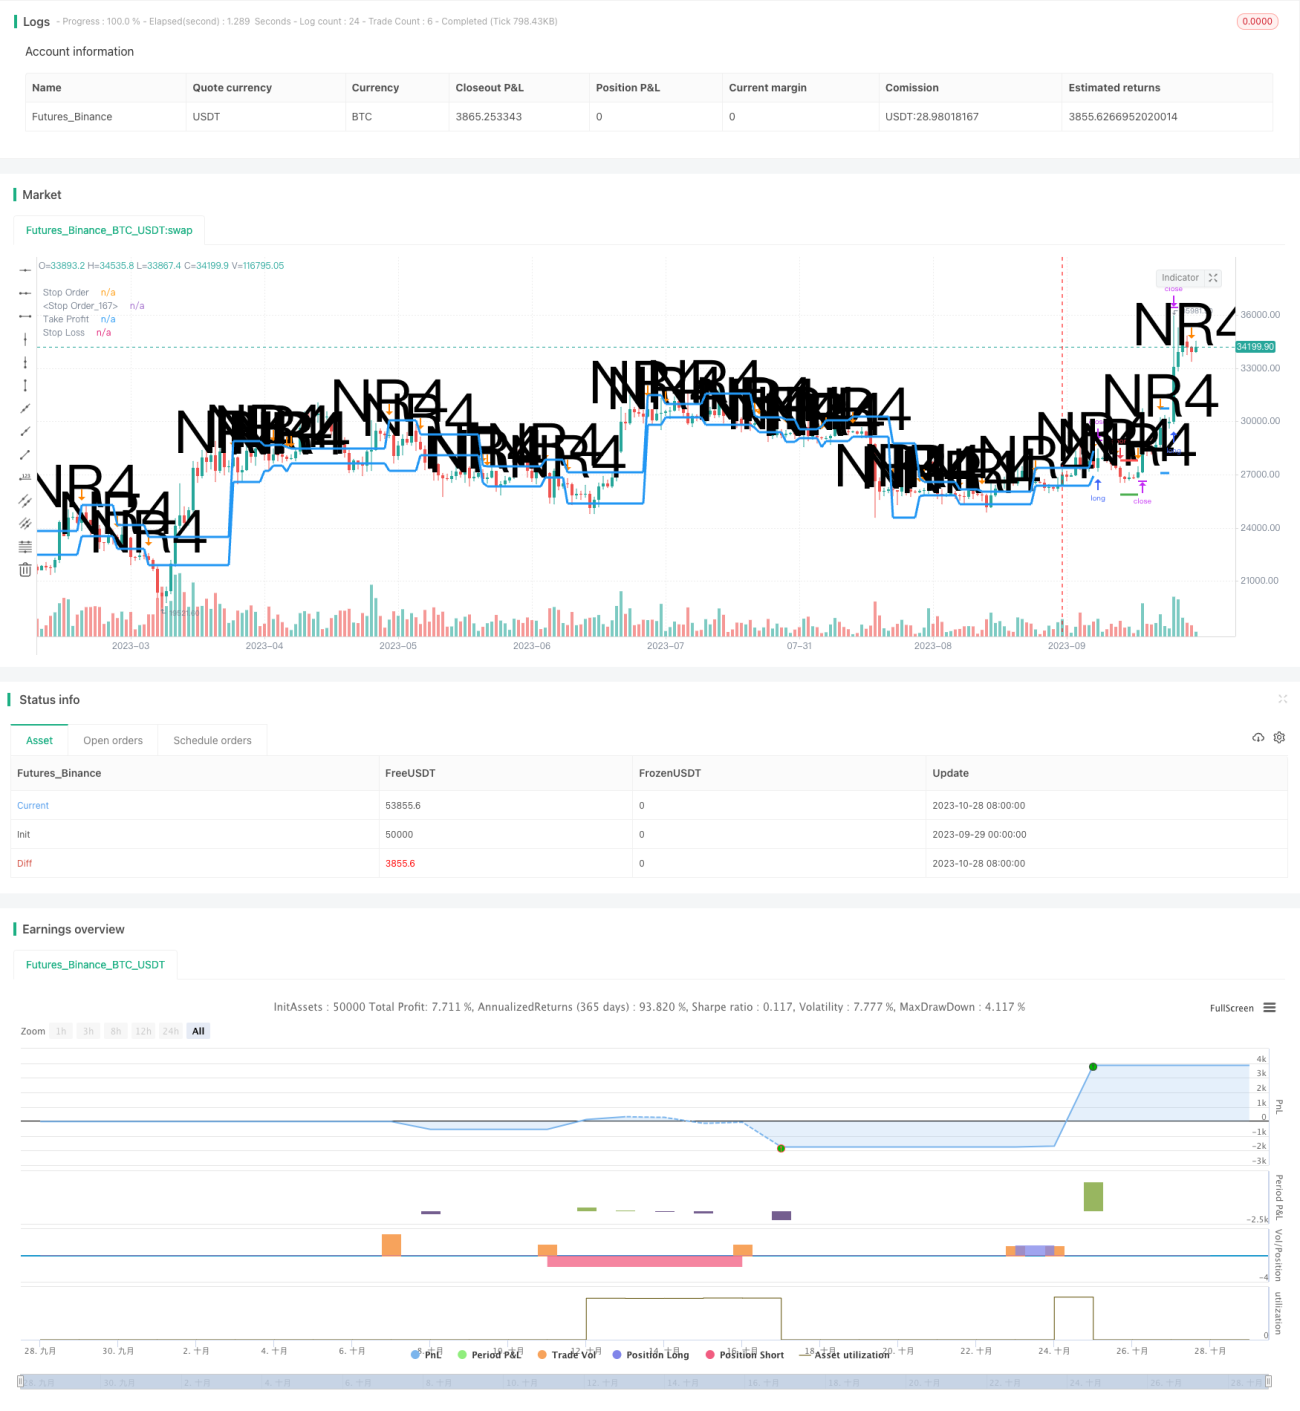
Chiến lược đảo ngược phạm vi ngủ sử dụng thời gian biến động giá giảm làm tín hiệu đặt hàng và lấy lợi nhuận khi biến động giá tăng trở lại. Nó bắt kịp xu hướng giá sắp nổ bằng cách xác định khi giá bị giới hạn trong phạm vi ngủ hẹp của biến động. Chiến lược này thường được sử dụng khi biến động hiện tại ở mức thấp hơn, nhưng có thể xảy ra trong tương lai.
Chiến lược này đầu tiên xác định phạm vi ngủ, tức là giá bị giới hạn trong phạm vi giá ngày giao dịch trước. Điều này cho thấy tỷ lệ biến động hiện tại đã giảm so với vài ngày trước. Chúng tôi đánh giá mức độ ngủ bằng cách so sánh giá cao nhất trong ngày giao dịch hiện tại với giá cao nhất n ngày trước (thường là 4 ngày) và giá thấp nhất trong ngày giao dịch hiện tại với giá thấp nhất n ngày trước.
Một khi đã xác định được phạm vi ngủ, chiến lược này sẽ mở hai lệnh treo cùng một lúc: một lệnh mua được đặt gần mức cao của phạm vi, và một lệnh bán được đặt gần mức thấp của phạm vi. Sau đó, chờ đợi giá phá vỡ phạm vi ngủ tiếp tục chạy lên hoặc xuống. Nếu giá phá vỡ lên, lệnh mua sẽ được kích hoạt để tạo vị trí nhiều đầu; nếu phá vỡ xuống, lệnh bán sẽ được kích hoạt để tạo vị trí trống.
Sau khi thiết lập vị trí, chiến lược sẽ thiết lập lệnh dừng lỗ và lệnh dừng bán. Lệnh dừng lỗ có thể hạn chế rủi ro đi xuống, lệnh dừng được sử dụng để giữ vị trí bình thường sau khi thu được lợi nhuận.
Cuối cùng, chiến lược này cũng bao gồm mô-đun quản lý tiền. Điều chỉnh số tiền giao dịch theo đơn đặt hàng bằng phương pháp nhân số cố định, tăng tỷ lệ sử dụng tiền khi lợi nhuận và giảm rủi ro khi thua lỗ.
Chiến lược này có một số ưu điểm:
Sử dụng thời điểm biến động giảm như là một tín hiệu đặt hàng, để nắm bắt cơ hội trước khi xu hướng giá xảy ra.
Trong khi đó, đặt lệnh nhị phân hai chiều, có thể nắm bắt xu hướng tăng hoặc giảm.
Sử dụng chiến lược dừng lỗ có thể kiểm soát hiệu quả rủi ro giao dịch đơn.
Sử dụng phương pháp quản lý tài chính với tỷ lệ cố định có thể cải thiện hiệu quả sử dụng tài chính.
Chiến lược logic đơn giản, rõ ràng và dễ thực hiện.
Chiến lược này cũng có một số rủi ro cần lưu ý:
Rủi ro đánh giá sai hướng phá vỡ phạm vi ngủ. Giá có thể phá vỡ lên xuống không rõ ràng, dẫn đến sai hướng vào.
Rủi ro không thể tiếp tục hoạt động theo hướng sau khi đột phá.
Rủi ro bị phá vỡ. Trong trường hợp đặc biệt, có thể phá vỡ đường dừng.
Rủi ro gia tăng lỗ hổng của hệ số cố định. Bạn có thể giảm giá trị hệ số cố định để giảm rủi ro.
Thiết lập tham số không đúng cách có thể dẫn đến hiệu quả chiến lược kém.
Chiến lược này cũng có thể được tối ưu hóa theo các khía cạnh sau:
Tăng tín hiệu lọc để tránh đột phá sai.
Cải thiện các chiến lược dừng lỗ, chẳng hạn như di chuyển dừng lỗ, dừng lỗ trên danh sách.
Tăng các chỉ số đánh giá xu hướng để tránh đảo ngược.
Tối ưu hóa giá trị nhân số cố định, cân bằng tỷ lệ lợi nhuận / lỗ.
Kết hợp nhiều phân tích chu kỳ thời gian, tăng khả năng kiếm lợi nhuận.
Sử dụng phương pháp học máy để tự động tối ưu hóa các tham số.
Chiến lược đảo ngược xu hướng nằm yên có ý tưởng tổng thể rõ ràng và có tiềm năng lợi nhuận nhất định. Có thể nâng cao sự ổn định của chiến lược thông qua các phương tiện như tối ưu hóa tham số, quản lý rủi ro và lọc tín hiệu. Tuy nhiên, bất kỳ chiến lược đảo ngược xu hướng nào cũng có một số rủi ro, cần sử dụng thận trọng và điều chỉnh quy mô vị trí thích hợp. Chiến lược này phù hợp với người giao dịch quen thuộc với hoạt động đảo ngược và nhận thức rủi ro.
/*backtest
start: 2023-09-29 00:00:00
end: 2023-10-29 00:00:00
period: 1d
basePeriod: 1h
exchanges: [{"eid":"Futures_Binance","currency":"BTC_USDT"}]
*/
// This source code is subject to the terms of the Mozilla Public License 2.0 at https://mozilla.org/MPL/2.0/
// © gsanson66
//This code is based on the Narrow Range strategy
//Interactive Broker fees are applied on this strategy
//@version=5
strategy("NARROW RANGE BACKTESTING", shorttitle="NR BACKTESTING", overlay=true, initial_capital=1000, default_qty_type=strategy.fixed, commission_type=strategy.commission.percent, commission_value=0.18)
//--------------------------------FUNCTIONS------------------------------------//
//@function to print label
debugLabel(txt, color) =>
label.new(bar_index, high, text = txt, color=color, style = label.style_label_lower_right, textcolor = color.black, size = size.small)
//@function which looks if the close date of the current bar falls inside the date range
inBacktestPeriod(start, end) => (time >= start) and (time <= end)
//--------------------------------USER INPUTS------------------------------------//
//Narrow Range Length
nrLength = input.int(4, minval=2, title="Narrow Range Length", group="Strategy parameters")
//Risk Management
stopLossInput = input.float(0.5, title="Stop Loss (in percentage of reference range)", group="Strategy parameters")
//Money Management
fixedRatio = input.int(defval=400, minval=1, title="Fixed Ratio Value ($)", group="Money Management")
increasingOrderAmount = input.int(defval=200, minval=1, title="Increasing Order Amount ($)", group="Money Management")
//Backtesting period
startDate = input(title="Start Date", defval=timestamp("1 Janv 2020 00:00:00"), group="Backtesting Period")
endDate = input(title="End Date", defval=timestamp("1 July 2024 00:00:00"), group="Backtesting Period")
//--------------------------------VARIABLES INITIALISATION--------------------------//
strategy.initial_capital = 50000
bool nr = na
var bool long = na
var bool short = na
var float stopPriceLong = na
var float stopLossLong = na
var float takeProfitLong = na
var float stopPriceShort = na
var float stopLossShort = na
var float takeProfitShort = na
var float takeProfit = na
var float stopLoss = na
bool inRange = na
int closedtrades = strategy.closedtrades
equity = math.abs(strategy.equity - strategy.openprofit)
var float capital_ref = strategy.initial_capital
var float cashOrder = strategy.initial_capital * 0.95
//------------------------------CHECKING SOME CONDITIONS ON EACH SCRIPT EXECUTION-------------------------------//
//Checking if the date belong to the range
inRange := true
//Checking performances of the strategy
if equity > capital_ref + fixedRatio
spread = (equity - capital_ref)/fixedRatio
nb_level = int(spread)
increasingOrder = nb_level * increasingOrderAmount
cashOrder := cashOrder + increasingOrder
capital_ref := capital_ref + nb_level*fixedRatio
if equity < capital_ref - fixedRatio
spread = (capital_ref - equity)/fixedRatio
nb_level = int(spread)
decreasingOrder = nb_level * increasingOrderAmount
cashOrder := cashOrder - decreasingOrder
capital_ref := capital_ref - nb_level*fixedRatio
//We check if a trade has been closed to cancel all previous orders
if closedtrades > closedtrades[1]
strategy.cancel("Long")
strategy.cancel("Short")
stopPriceLong := na
stopPriceShort := na
//Checking if we close all trades in case where we exit the backtesting period
if strategy.position_size!=0 and not inRange
debugLabel("END OF BACKTESTING PERIOD : we close the trade", color=color.rgb(116, 116, 116))
strategy.close_all()
long := na
short := na
stopPriceLong := na
stopLossLong := na
takeProfitLong := na
stopPriceShort := na
stopLossShort := na
takeProfitShort := na
takeProfit := na
stopLoss := na
//----------------------------------FINDING NARROW RANGE DAY------------------------------------------//
// We find the Narrow Range Day
if low > low[nrLength] and high < high[nrLength]
nr := true
//------------------------------------STOP ORDERS--------------------------------------------//
// We handle plotting of stop orders and cancellation of other side order if one order is triggered
if strategy.position_size > 0 and not na(stopPriceLong) and not na(stopPriceShort)
long := true
strategy.cancel("Short")
stopPriceLong := na
stopPriceShort := na
takeProfit := takeProfitLong
stopLoss := stopLossLong
if strategy.position_size < 0 and not na(stopPriceLong) and not na(stopPriceShort)
short := true
strategy.cancel("Long")
stopPriceLong := na
stopPriceShort := na
takeProfit := takeProfitShort
stopLoss := stopLossShort
//------------------------------------STOP LOSS & TAKE PROFIT--------------------------------//
// If an order is triggered we plot TP and SL
if not na(takeProfit) and not na(stopLoss) and long
if high >= takeProfit and closedtrades == closedtrades[1] + 1
takeProfit := na
stopLoss := na
long := na
if low <= stopLoss and closedtrades == closedtrades[1] + 1
takeProfit := na
stopLoss := na
long := na
if not na(takeProfit) and not na(stopLoss) and short
if high >= stopLoss and closedtrades == closedtrades[1] + 1
takeProfit := na
stopLoss := na
short := na
if low <= takeProfit and closedtrades == closedtrades[1] + 1
takeProfit := na
stopLoss := na
short := na
//-----------------------------LONG/SHORT CONDITION-------------------------//
// Conditions to create two stop orders (one for Long and one for Short) and SL & TP calculation
if nr and inRange and strategy.position_size == 0
stopPriceLong := high[4]
takeProfitLong := high[4] + (high[4] - low[4])
stopLossLong := high[4] - (high[4] - low[4])*stopLossInput
qtyLong = cashOrder/stopPriceLong
strategy.entry("Long", strategy.long, qtyLong, stop=stopPriceLong)
strategy.exit("Exit Long", "Long", limit=takeProfitLong ,stop=stopLossLong)
stopPriceShort := low[4]
takeProfitShort := low[4] - (high[4] - low[4])
stopLossShort := low[4] + (high[4] - low[4])*stopLossInput
qtyShort = cashOrder/stopPriceShort
strategy.entry("Short", strategy.short, qtyShort, stop=stopPriceShort)
strategy.exit("Exit Short", "Short", limit=takeProfitShort ,stop=stopLossShort)
//--------------------------PLOTTING ELEMENT----------------------------//
plotshape(nr, "NR", shape.arrowdown, location.abovebar, color.rgb(255, 132, 0), text= "NR4", size=size.huge)
plot(stopPriceLong, "Stop Order", color.blue, 3, plot.style_linebr)
plot(stopPriceShort, "Stop Order", color.blue, 3, plot.style_linebr)
plot(takeProfit, "Take Profit", color.green, 3, plot.style_linebr)
plot(stopLoss, "Stop Loss", color.red, 3, plot.style_linebr)