
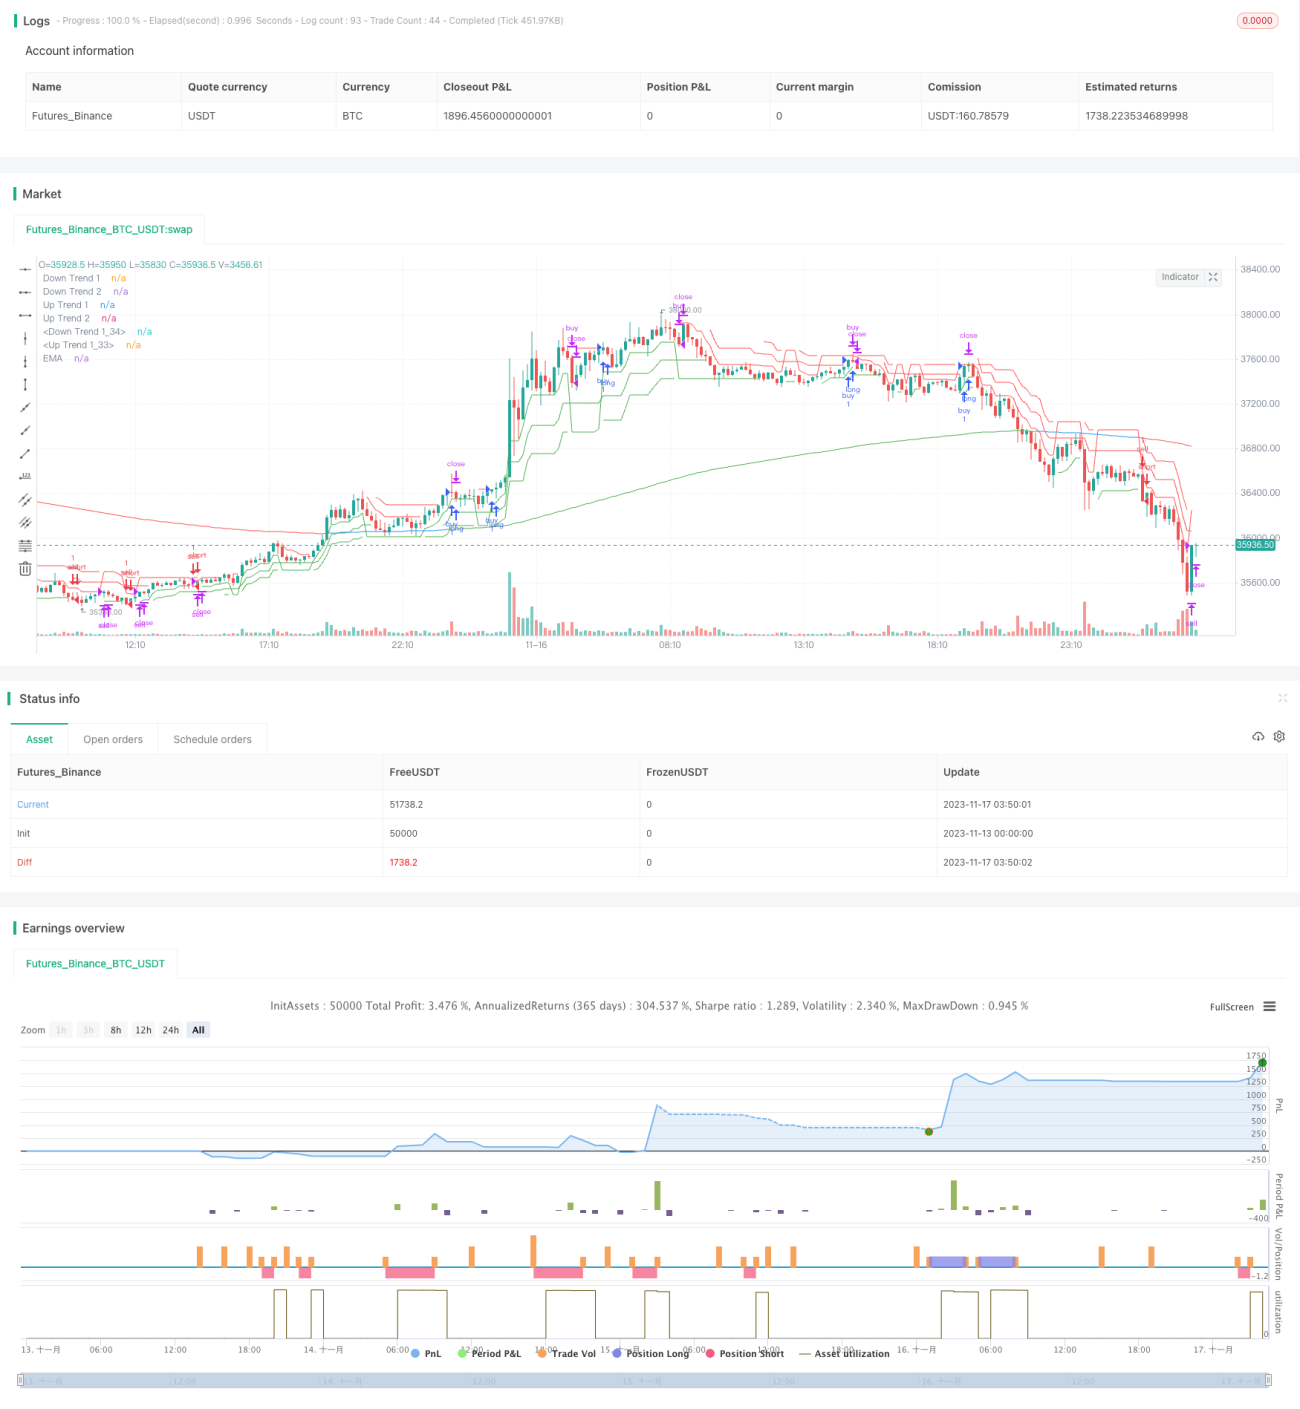
Chiến lược này tạo ra một kênh hai tam giác, kết hợp với chỉ số siêu xu hướng để xác định hướng phá vỡ giá, để đạt được tỷ lệ thắng cao trong hoạt động phá vỡ theo dõi. Chiến lược này kết hợp với EMA để xác định xu hướng tổng thể của thị trường và tránh giao dịch không hiệu quả trong tình huống xung đột.
Xây dựng một chỉ số siêu xu hướng với ba tham số khác nhau để xác định xu hướng ngắn hạn, trung hạn và dài hạn của giá cả.
Đánh giá xem giá đã phá vỡ đường đi lên hay xuống bằng cách sử dụng đường hai tam giác, làm tín hiệu ListEntry và Exit.
Kết hợp 233 chu kỳ EMA để xác định hướng xu hướng tổng thể, giá sẽ cần phải làm nhiều hơn để phá vỡ kênh lên trên của thị trường nhiều đầu EMA và trống khi phá vỡ kênh xuống của thị trường trống.
Xác định tín hiệu dừng và dừng lỗ bằng cách kết hợp ba chỉ số siêu xu hướng. Đặt lệnh dừng hoặc dừng lỗ khi có hơn hai chỉ số biến đổi màu.
Dual-triangle channel kết hợp với nhiều thời gian phân tích, có thể nắm bắt chính xác các đột phá xu hướng.
Các điều kiện lọc đa cấp có thể giúp tránh các giao dịch không có hiệu lực và tăng tỷ lệ chiến thắng.
Động thái theo dõi dừng lỗ, giảm nguy cơ rút lui.
Thiết lập tham số đơn giản, dễ sử dụng.
Trong thị trường có biến động chu kỳ lớn, có thể xảy ra tình huống mở vị trí thường xuyên và sau đó bị dừng. Các tham số chu kỳ ATR có thể được điều chỉnh thích hợp để giảm tần suất mở vị trí.
Chu kỳ EMA quá ngắn không thể xác định xu hướng tổng thể, quá dài thì không theo dõi nhạy cảm. Đề xuất thử nghiệm để xác định tham số EMA tối ưu.
Mức dừng lỗ không thể theo dõi động sự thay đổi tỷ lệ dao động của thị trường và cần điều chỉnh bằng can thiệp nhân tạo.
Chiến lược phá vỡ hai tam giác của Moonlight Tracker được thực hiện bằng cách kết hợp các chỉ số xu hướng siêu với các kênh hai tam giác để nắm bắt chính xác các đột phá mạnh mẽ. Trong khi đó, cơ chế lọc đa cấp có thể lọc các tín hiệu không hiệu quả, có tỷ lệ thắng cao. Cài đặt tham số đơn giản cũng làm cho nó dễ dàng để sử dụng.
/*backtest
start: 2023-11-13 00:00:00
end: 2023-11-17 04:00:00
period: 10m
basePeriod: 1m
exchanges: [{"eid":"Futures_Binance","currency":"BTC_USDT"}]
*/
// @version=5
// author=theasgard and moonshot-indicator (ms)
// year 2021
//
// This is a well knowen strategy by using 3 different Supertrends and a trend-defining EMA,
// feel free to play around with the settings, a backtest on 8h ETHUSDT pair brought some good results using
// the 233EMA and investing 75% of a 10k start capital
//
// the idea is to have at least 2 supertrnds going green above the trend-EMA to go long and exit by turning
// 2 supertrends red (idea: 1 supertrend in red could initialize a take profit)
// shorts work vice versa
// The EMA shows in green for uptrends and in red for downtrends, if it is blue no Signal will be taken because
// the 3 supertrends are not all above or below the trendline(EMA)
strategy("ms hypertrender", overlay=true)
// set up 3 supertrendlines and colour the direction up/down
atrPeriod1 = input(10, "ATR Length 1")
factor1 = input.float(1.0, "ATR Factor 1", step = 0.01)
[supertrend1, direction1] = ta.supertrend(factor1, atrPeriod1)
upTrend1 = plot(direction1 < 0 ? supertrend1 : na, "Up Trend 1", color = color.green, style=plot.style_linebr)
downTrend1 = plot(direction1 < 0? na : supertrend1, "Down Trend 1", color = color.red, style=plot.style_linebr)
atrPeriod2 = input(11, "ATR Length 2")
factor2 = input.float(2.0, "ATR Factor 2", step = 0.01)
[supertrend2, direction2] = ta.supertrend(factor2, atrPeriod2)
upTrend2 = plot(direction2 < 0 ? supertrend2 : na, "Up Trend 2", color = color.green, style=plot.style_linebr)
downTrend2 = plot(direction2 < 0? na : supertrend2, "Down Trend 2", color = color.red, style=plot.style_linebr)
atrPeriod3 = input(12, "ATR Length 3")
factor3 = input.float(3.0, "ATR Factor 3", step = 0.01)
[supertrend3, direction3] = ta.supertrend(factor3, atrPeriod3)
upTrend3 = plot(direction3 < 0 ? supertrend3 : na, "Up Trend 1", color = color.green, style=plot.style_linebr)
downTrend3 = plot(direction3 < 0? na : supertrend3, "Down Trend 1", color = color.red, style=plot.style_linebr)
//set up the trend dividing EMA and color uptrend nutreal downtrend
len = input.int(233, minval=1, title="Trend-EMA Length")
src = input(close, title="Source")
offset = input.int(title="Offset", defval=0, minval=-500, maxval=500)
//general Bull or Bear Trend? Visualized by ema
ematrend = ta.ema(src, len)
generaluptrend = supertrend1 > ematrend and supertrend2 > ematrend and supertrend3 > ematrend
generaldowntrend = supertrend1 < ematrend and supertrend2 < ematrend and supertrend3 < ematrend
emacolor = if generaluptrend
color.green
else if generaldowntrend
color.red
else
color.blue
plot(ematrend, title="EMA", color=emacolor, offset=offset)
// Bullish? min 2 supertrends green
bullish = (direction1 < 0 and direction2 < 0) or (direction1 < 0 and direction3 < 0) or (direction2 < 0 and direction3 < 0) and generaluptrend
extremebullish = direction1 < 0 and direction2 < 0 and direction3 < 0 and generaluptrend //all 3 green
// Bearish? min 2 supertrends red
bearish = (direction1 > 0 and direction2 > 0) or (direction1 > 0 and direction3 > 0) or (direction2 > 0 and direction3 > 0) and generaldowntrend
extremebearish = direction1 > 0 and direction2 > 0 and direction3 > 0 and generaldowntrend //all 3 red
// Open Long
//plotchar(((bullish and not bullish[1]) or (extremebullish and not extremebullish[1])) and (emacolor==color.green)? close : na, title = 'Start Long', char='▲', color = #80eb34, location = location.belowbar, size = size.small)
// TP 10% Long
TP10long = ((generaluptrend and bullish[1]) or (generaluptrend and extremebullish[1])) and (direction1 > 0 or direction2 > 0 or direction3 > 0)
//plotchar(TP10long and not TP10long[1]? close : na, title = 'TP on Long', char='┼', color = #ffd000, location = location.abovebar, size = size.tiny)
// Exit Long
//plotchar(extremebearish and not extremebearish[1] or bearish and not bearish[1]? close : na, title = 'Close all Longs', char='Ꭓ', color = #ff0037, location = location.abovebar, size = size.tiny)
// Open Short
//plotchar(((bearish and not bearish[1]) or (extremebearish and not extremebearish[1])) and (emacolor==color.red)? close : na, title = 'Start Short', char='▼', color = #0547e3, location = location.abovebar, size = size.small)
// TP 10% Short
TP10short = ((generaldowntrend and bearish[1]) or (generaldowntrend and extremebearish[1])) and (direction1 < 0 or direction2 < 0 or direction3 < 0)
//plotchar(TP10short and not TP10short[1]? close : na, title = 'TP on Short', char='┼', color = #ffd000, location = location.belowbar, size = size.tiny)
// Exit Short
//plotchar(extremebullish and not extremebullish[1] or bullish and not bullish[1]? close : na, title = 'Close all Shorts', char='Ꭓ', color = #ff0037, location = location.belowbar, size = size.tiny)
// Set stop loss level with input options (optional)
longLossPerc = input.float(title="Long Stop Loss (%)",
minval=0.0, step=0.1, defval=1) * 0.01
shortLossPerc = input.float(title="Short Stop Loss (%)",
minval=0.0, step=0.1, defval=1) * 0.01
// Determine stop loss price
longStopPrice = strategy.position_avg_price * (1 - longLossPerc)
shortStopPrice = strategy.position_avg_price * (1 + shortLossPerc)
openlong = (((bullish and not bullish[1]) or (extremebullish and not extremebullish[1])) and (emacolor==color.green))
openshort = (((bearish and not bearish[1]) or (extremebearish and not extremebearish[1])) and (emacolor==color.red))
exitlong = (extremebearish and not extremebearish[1] or bearish and not bearish[1]) or TP10long
exitshort = (extremebullish and not extremebullish[1] or bullish and not bullish[1]) or TP10short
strategy.entry("buy", strategy.long, when=openlong)
strategy.entry("sell", strategy.short, when=openshort)
strategy.close("buy", when=exitlong)
strategy.close("sell", when=exitshort)
// Submit exit orders based on calculated stop loss price
if (strategy.position_size > 0)
strategy.exit(id="Long Stop", stop=longStopPrice)
if (strategy.position_size < 0)
strategy.exit(id="Short Stop", stop=shortStopPrice)